Statistics for Analytics
Session 1: Data & Data Collection

Today’s route
Good analytics begins before calculation: with a useful question and trustworthy data.
Data & Decisions
What is data?
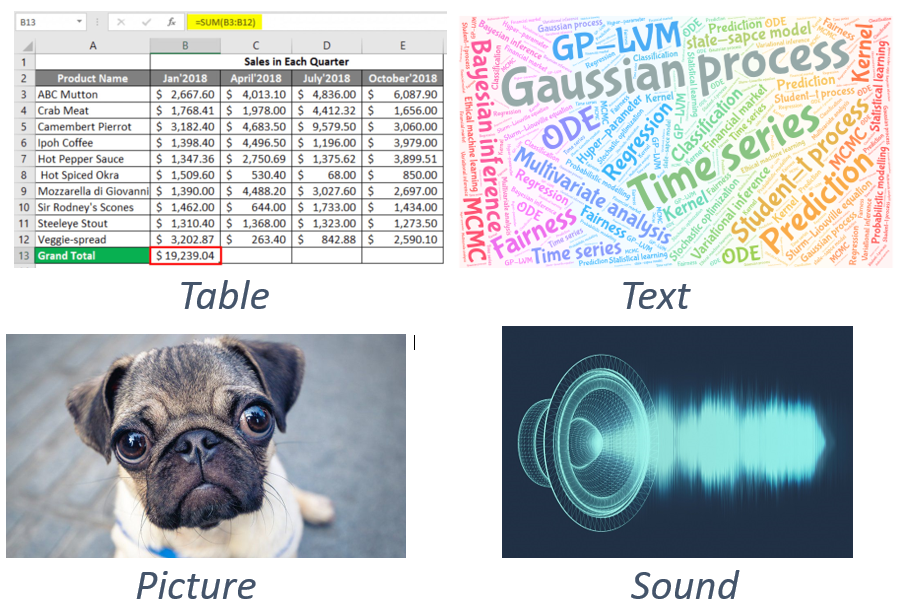
Data are recorded evidence
Data are raw facts, measurements, or observations collected for a purpose. Analysis gives those records context and turns them into information that can support knowledge and decisions.
Structured data
Organised into a defined format, such as rows and columns, with dates, amounts, or categories.
Unstructured data
Text, audio, images, documents, and video that do not fit neatly into a traditional table.
Data underpin work across banking, healthcare, marketing, government, and scientific research. Modern tools help us process them at increasing scale, but meaning, source, and quality still matter.
Observation, variable, value
| Record | Age | Balance (€) | Housing loan | Term deposit? |
|---|---|---|---|---|
| 1 | 58 | 2,143 | Yes | No |
| 2 | 44 | 29 | Yes | No |
| 3 | 33 | 2 | Yes | No |
- Observation: one client’s campaign record
- Variable: one recorded characteristic, such as balance
- Value: one entry, such as €29
Source: Moro, Rita & Cortez, Bank Marketing (45,211 real campaign records), UCI dataset and documentation, CC BY 4.0.
From data to decisions
Statistics helps us judge evidence and make decisions under uncertainty.
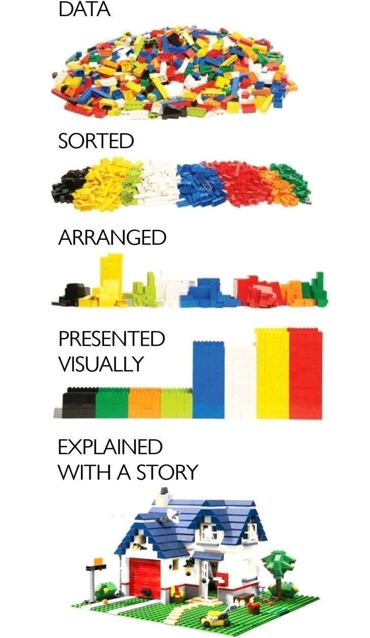
- Question: define the decision and the evidence needed.
- Prepare: collect, clean, sort, and organise relevant data.
- Analyse: summarise and visualise patterns; assess uncertainty.
- Explain and act: communicate the findings and decide what should change.
Bank marketing: the question
Decision: Which contact method should the bank use in its next campaign?

A Portuguese bank ran phone campaigns offering term deposits.
- Data: 45,211 campaign records.
- Outcome: subscription, recorded as
yesorno. - Overall: 5,289 subscriptions, or 11.7% of records.
Start with a comparison: subscription rates by recorded contact method.
Source: Moro, Rita & Cortez, UCI Bank Marketing, bank-full.csv, CC BY 4.0.
Bank marketing: the finding and next step
| Last contact method | Subscribed | Records | Subscription rate |
|---|---|---|---|
| Cellular | 4,369 | 29,285 | 14.9% |
| Telephone | 390 | 2,906 | 13.4% |
| Unknown | 530 | 13,020 | 4.1% |
Finding
The observed cellular rate is 1.5 percentage points higher than the telephone rate. Customer mix and campaign timing may help explain the gap.
Next step
Randomly assign contact methods among customers reachable by either method, then compare subscription rates.
Source: UCI Bank Marketing, bank-full.csv, CC BY 4.0. “Unknown” marks an unspecified contact method.
Collecting Data
From question to data source
Who?
Target population
What?
Variables and outcome
How?
Study design
When?
Time window
| Data source | Meaning | Bank marketing example |
|---|---|---|
| Primary | Collect data for this question | Run a new randomised campaign |
| Secondary | Reuse data collected for another purpose | Analyse historical campaign records |
Primary data offer more control; secondary data can save time and cost.
Common collection methods
| Method | Examples |
|---|---|
| Surveys and interviews | Questionnaires, opinion polls, customer interviews |
| Observation | Record behaviour directly or through sensors |
| Experiments | Randomly assign offers or messages in an A/B test |
| Operational records | Transactions, support tickets, website and app logs |
| Websites and APIs | Download open data, query APIs, or scrape web pages |
| Social media | Posts, comments, reviews, and engagement counts |
Record the source, collection time, sampling rules, and access conditions.
Finance and banking data at Edinburgh
Wharton Research Data Services (WRDS)
A common interface for research datasets including Compustat, CRSP, BoardEx, ExecuComp, and ISS Directors data.
Access: Register with your University details; approval can take up to three working days.
FAME
Detailed financial information for UK and Irish companies, updated monthly with up to ten years of data. Search by 300+ criteria, compare peers, and create sector reports.
Access: On or off campus; select the University of Edinburgh when signing in.
S&P Capital IQ Pro
Global company, financial, market, news, and analytics data, with specialist coverage of banks and insurers, including 50,000+ listed, unlisted, and subsidiary banks.
Access: On or off campus; self-register using your University email address.
LSEG Workspace
Reuters news, global pricing, company fundamentals, I/B/E/S estimates, deals and league tables, Datastream, commodities, research, and analytics.
Access: Application required; available to eligible Business School Year 3/4 undergraduates and postgraduate students.
Access routes, registration instructions, and current eligibility: University of Edinburgh Library, Business databases A–Z. Subscription terms can change, so check the Library page before use.
Census or sample?
Census
- Measure every population unit
- No sampling uncertainty
- Often slow or expensive
Sample
- Measure a population subset
- Faster and cheaper
- Requires representative selection
Sampling can fail
| Risk | What goes wrong? | Example |
|---|---|---|
| Undercoverage | Some groups cannot be selected | Online-only survey |
| Non-response | Selected people do not answer | Busy customers opt out |
| Voluntary response | Strong opinions dominate | Public web poll |
| Survivorship | Failures disappear | Study only active firms |
More data do not repair a biased selection process.
Measurement can fail too
“How satisfied are you with our excellent new service?” is a leading question.
- Define variables before collection.
- Use neutral wording and consistent instruments.
- Pilot the process on a small sample.
- Record missingness and changes in definition.
Statistical Foundations
From sample to population
| Population | Sample | |
|---|---|---|
| Who? | All customers covered by our question | Customers represented in the observed records |
| Summary | Parameter: a numerical feature of the population | Statistic: a numerical summary of the sample |
Description
Summarise the observed data: 11.7% of campaign records show a subscription.
Inference
Use the sample to estimate the population’s subscription rate and quantify uncertainty.
Bank example: UCI Bank Marketing, 5,289 subscriptions among 45,211 records.
Data Types
Types of variables
A variable records a characteristic of each observation. Its type determines which comparisons, summaries, and plots are meaningful.
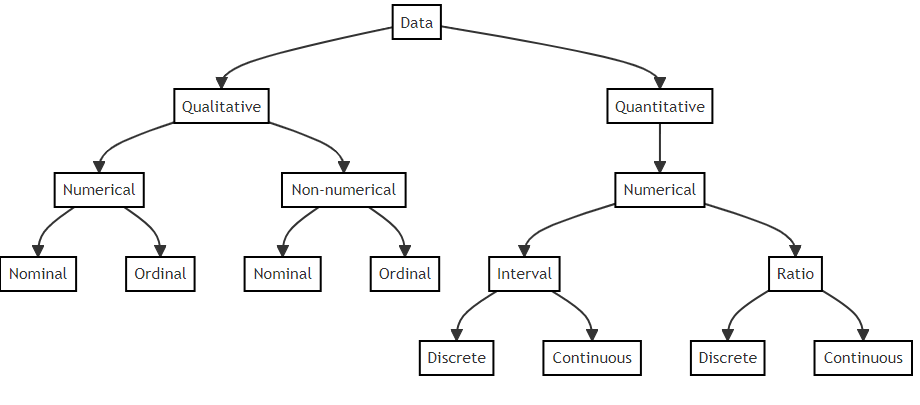
Four measurement scales
Measurement scales determine which comparisons are meaningful.
| Scale / type | Meaning | Example |
|---|---|---|
| Nominal (categorical) | Unordered categories; numbers serve as labels. | Payment method: 1 = card, 2 = cash |
| Ordinal (categorical) | Ordered categories; gaps between ranks need not be equal. | Satisfaction: low < medium < high |
| Interval (numerical) | Equal intervals are meaningful; there is no absolute zero. | Temperature in °C: a 10-degree difference |
| Ratio (numerical) | Equal intervals and an absolute zero make ratios meaningful. | Duration: 24 months is twice 12 months |
Numerical variables can also be discrete (counts, e.g. complaints) or continuous (measurements, e.g. waiting time).
Likert scales need care
| Rating | Label |
|---|---|
| 1 | Strongly disagree |
| 2 | Disagree |
| 3 | Neither |
| 4 | Agree |
| 5 | Strongly agree |
One item is ordinal. A carefully validated multi-item score is sometimes treated as numerical.
Cross-sectional, time-series, panel
| Cross-sectional | Time-series | Panel | |||||
|---|---|---|---|---|---|---|---|
| Many loans · one year Balances in 2023 |
One loan · many years Balances for Loan A |
Many loans · many years Balances for the same loans |
|||||
| Loan | Balance | Year | Balance | Loan / year | 2023 | 2024 | 2025 |
| Loan A | 180 | 2023 | 180 | Loan A | 180 | 170 | 160 |
| Loan B | 240 | 2024 | 170 | Loan B | 240 | 225 | 210 |
| Loan C | 150 | 2025 | 160 | Loan C | 150 | 140 | 130 |
In the panel, read down one year for a cross-section or across one loan for a time series.
Relationships
Relationships among variables
Do clients with higher credit limits tend to have larger bills?
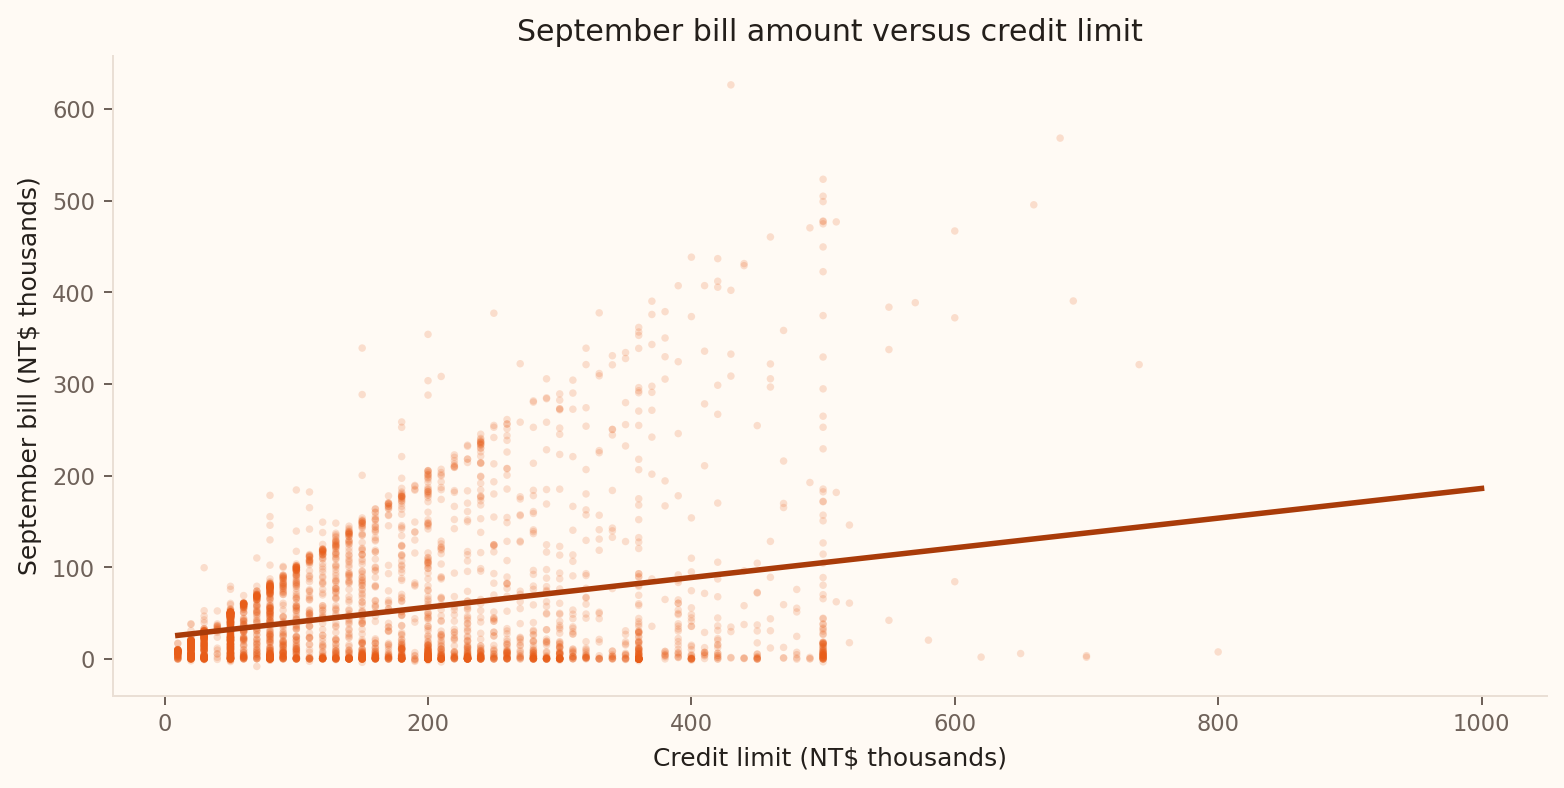
- Each dot represents one client.
- Look for direction, form, spread, and unusual points.
- The line summarises a positive association, with wide variation.
Source: Yeh, UCI Default of Credit Card Clients, CC BY 4.0. Plot shows 3,500 sampled clients; the fitted line uses all 30,000 records.
Explanatory and response variables
\[\text{Explanatory variable} \longrightarrow \text{Response variable}\]
| Risk question | Explanatory | Response |
|---|---|---|
| Does repayment delay flag risk? | Delay status | Default next month? |
| Does credit limit track exposure? | Credit limit | Bill amount |
Names describe the analytical role, not necessarily causation.
Association, causation, and study design
Association describes a pattern. Causation concerns an intervention’s effect.
| Study design | Banking example | What the evidence supports |
|---|---|---|
| Observational comparison | Compare default rates for clients with and without repayment delays. | Association: income and existing debt may influence both delay and default. |
| Randomised experiment | Hypothetical trial: assign repayment reminders at random and compare later default rates. | Causal effect of the reminders, if the trial is well conducted. |
Match the claim to the design.
Source: Yeh, Default of Credit Card Clients (30,000 records), UCI dataset and documentation, CC BY 4.0.
Ethics & Governance
Data bias
Data bias is a systematic distortion in how data represent a population or phenomenon. Routine transactions, online activity, and administrative records reflect the systems that produce them.
Incomplete measures
Recorded variables may miss the concept we need. Account balance captures funds held at one bank; financial resilience also depends on income, debts, and other assets.
Human-generated content
Reviews, posts, and staff decisions reflect who contributes and how people judge others. Their attitudes and stereotypes can enter the dataset.
Random assignment reduces confounding. Coverage, measurement quality, and loss to follow-up still affect the evidence.
Data bias: five common sources
| Source | How it arises | Illustrative example |
|---|---|---|
| Response or activity bias | Some people are more likely to respond or contribute more often. | Vocal customers dominate reviews; prolific users dominate social-media posts. |
| Selection through feedback loops | A system’s choices shape the data it collects next. | Recommended products receive more exposure and clicks, reinforcing their ranking. |
| System drift | Historical data no longer represent the current setting. | Old repayment data are used after lending rules change the borrower mix. |
| Omitted variable bias | A missing factor affects the outcome and is related to an included predictor. | Omitting income distorts the estimated link between loan size and default. |
| Societal bias | Records reflect existing stereotypes or unequal treatment. | A model learns to reproduce unequal treatment in past loan approvals. |
Bias can enter anywhere
Collect
Who is missing?
Measure
Is the proxy fair?
Model
Whose error matters?
Deploy
Who is affected?
Check bias throughout collection, measurement, modelling, and deployment.
GDPR: protecting personal data
General Data Protection Regulation (GDPR) sets rules for collecting, using, storing, and sharing personal data, and protects individuals’ rights.
What counts as personal data?
Information about an identifiable living person: names, customer numbers, online identifiers, or location histories.
EU and UK frameworks
The EU GDPR applies across the EU/EEA. In the UK, the UK GDPR operates alongside the Data Protection Act 2018.
People have rights to be informed about data use, access their records, and correct inaccuracies. Rights such as erasure and objection apply in specified circumstances.
GDPR principles for analysts
| Principle | What it means in an analysis |
|---|---|
| Lawfulness, fairness and transparency | Establish a lawful basis, treat people fairly, and explain the use. |
| Purpose limitation | Specify why data are collected; check any new use. |
| Data minimisation | Collect only what the purpose requires. |
| Accuracy | Check records and correct errors. |
| Storage limitation | Set and follow a justified retention period. |
| Integrity and confidentiality | Protect data against misuse, loss, and unauthorised access. |
| Accountability | Record how these principles are met. |
Source: UK Information Commissioner’s Office, Guide to the UK GDPR data-protection principles.
Data sharing
How willing would you be to share these types of data, and with whom?
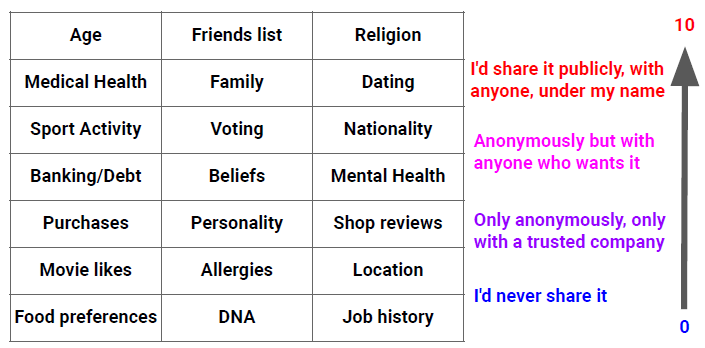
Share insight, not unnecessary identity
Before sharing
Remove direct identifiers; assess re-identification risk.
When publishing
Aggregate small groups; document limitations and access.
Anonymisation is a risk-reduction process, not a single delete operation.
Session 1 takeaway
- Begin with a decision and a precise question.
- Distinguish population parameters from sample statistics.
- Understand rows, variables, types, and time structure.
- Match claims to study design, quality, privacy, and ethics.
Check your understanding
A bank surveys only mobile-app users and concludes that all current-account customers prefer digital support.
What is the target population, and which source of bias is most likely?