Statistics for Analytics
Session 5: Estimation, Confidence Intervals & Testing

Today’s route
Report plausible parameter values, then ask how the data compare with a benchmark.
Estimates & Uncertainty
Case: estimating mean customer balance
Question: How precisely can 400 records estimate a bank’s mean recorded balance?
| Part of the problem | This classroom exercise |
|---|---|
| Population frame | 45,211 historical campaign records |
| Random sample | 400 records, selected without replacement |
| Point estimate | Sample mean balance: €1,517.92 |
| Target | Mean balance across the full frame |
UCI Bank Marketing, bank-full.csv, sample seed 11624. Treat the published records as the population for this exercise.
Two forms of inference
Estimation
What parameter values are plausible?
Hypothesis testing
Is a particular claim compatible with the data?
We will estimate a plausible range, then use the same sampling model to assess a benchmark.
Retrieve Week 4: parameter, estimator, estimate
| Parameter | Estimator |
|---|---|
| Population mean \(\mu\) | Sample mean \(\bar X\) |
| Population variance \(\sigma^2\) | Sample variance \(s^2\) |
| Population proportion \(p\) | Sample proportion \(\hat p\) |
A point estimate is the numerical value obtained from the observed sample.
For the balance case: target \(\mu\), rule \(\bar X\), observed estimate \(\bar x=€1{,}517.92\).
Loan defaults: parameter, estimator, estimate
A bank observes 20 defaults among 400 sampled loans over one year. What is our estimate of the population default rate?
| Concept | Notation or value | Meaning |
|---|---|---|
| Parameter | \(p\) | Unknown population default rate |
| Estimator | \(\hat p=D/n\) | Default count \(D\) divided by sample size \(n\) |
| Estimate | \(20/400=0.05=5\%\) | Numerical value from the observed sample |
The population rate \(p\) is fixed; another sample can give a different estimate \(\hat p\).
Illustrative loan sample; assume representative selection and a common one-year observation period.
Bias and precision
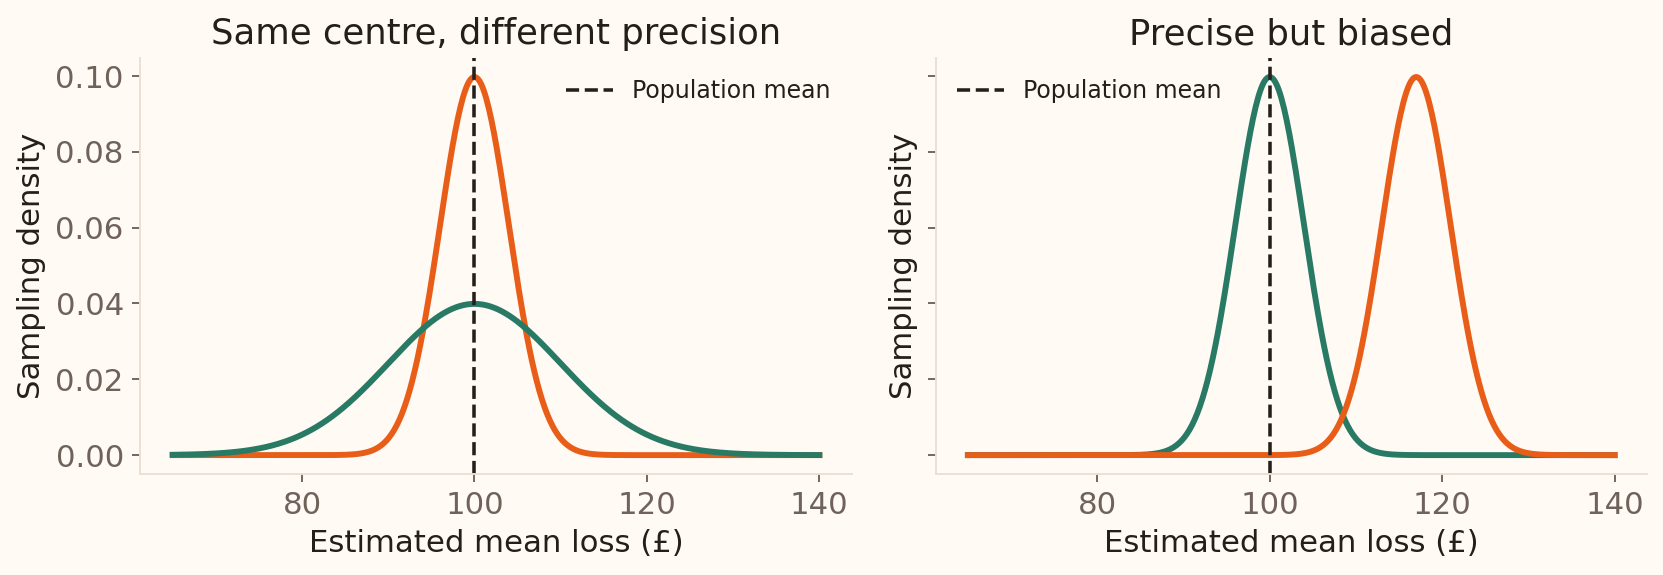
Bias shifts the centre away from the target; precision describes how tightly estimates cluster.
Illustrative estimator distributions; the dashed line marks a hypothetical true mean loss of £100.
What makes an estimator useful?
| Property | Mathematical statement | Meaning |
|---|---|---|
| Unbiasedness | \(E(\hat\theta)=\theta\) | Correct centre across repeated samples |
| Precision | Small \(\operatorname{Var}(\hat\theta)\) | Estimates cluster closely |
| Consistency | \(\hat\theta_n\xrightarrow{P}\theta\) | Concentrates near the target as \(n\) grows |
Compare efficiency among estimators of the same parameter, under the same model.
Compare three rules for estimating a mean
Take independent observations with common mean \(\mu\) and variance \(\sigma^2\).
| Estimator | Expected value | Variance |
|---|---|---|
| First observation \(X_1\) | \(\mu\) | \(\sigma^2\) |
| Sample mean \(\bar X\) | \(\mu\) | \(\sigma^2/n\) |
| Shifted mean \(\bar X+£10\) | \(\mu+£10\) | \(\sigma^2/n\) |
At \(n=25\): \(\operatorname{Var}(\bar X)=\sigma^2/25\), so \(SD(\bar X)=\sigma/5\).
Discuss: as \(n\) grows, which rule concentrates around \(\mu\)? Which stays too high? Which ignores the extra observations?
More data: which estimate approaches the target?
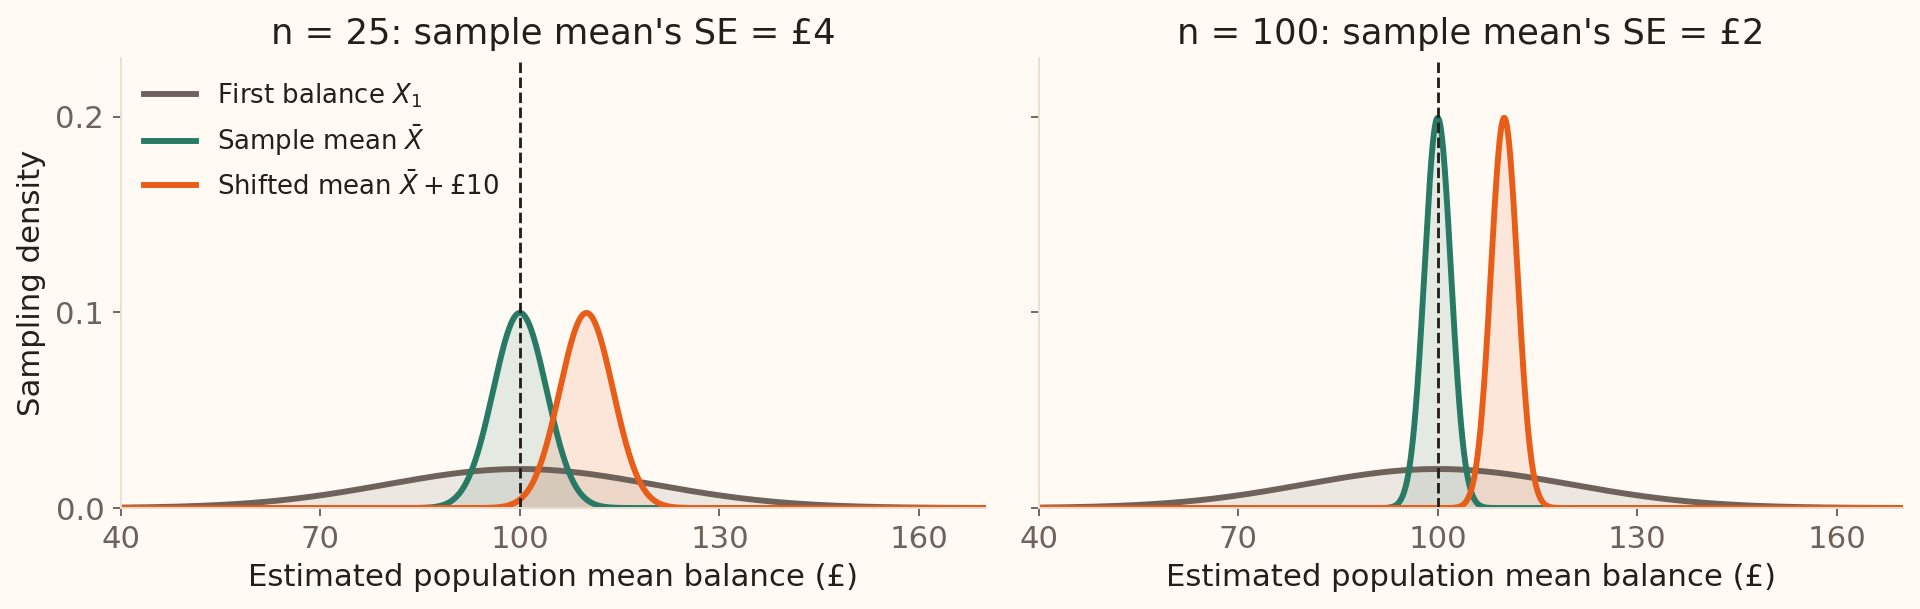
- \(X_1\): stays equally variable; it ignores the extra observations.
- \(\bar X\): concentrates around £100, the true mean.
- \(\bar X+£10\): concentrates around £110; its bias stays £10.
Illustrative independent normal balances: mean £100, SD £20. Curves are exact sampling densities; dashed line = true mean. Both panels use the same scales.
Confidence Intervals
How far could our estimate be from the target?
Week 4 gave the sampling distribution of the mean:
\[\bar X\approx N\!\left(\mu,\frac{\sigma^2}{n}\right).\]
If this model is appropriate, approximately 95% of sample means lie within 1.96 standard errors of \(\mu\).
We observe \(\bar x\), but \(\mu\) is unknown. Can we turn this probability statement into an interval for \(\mu\)?
Where does 1.96 come from?
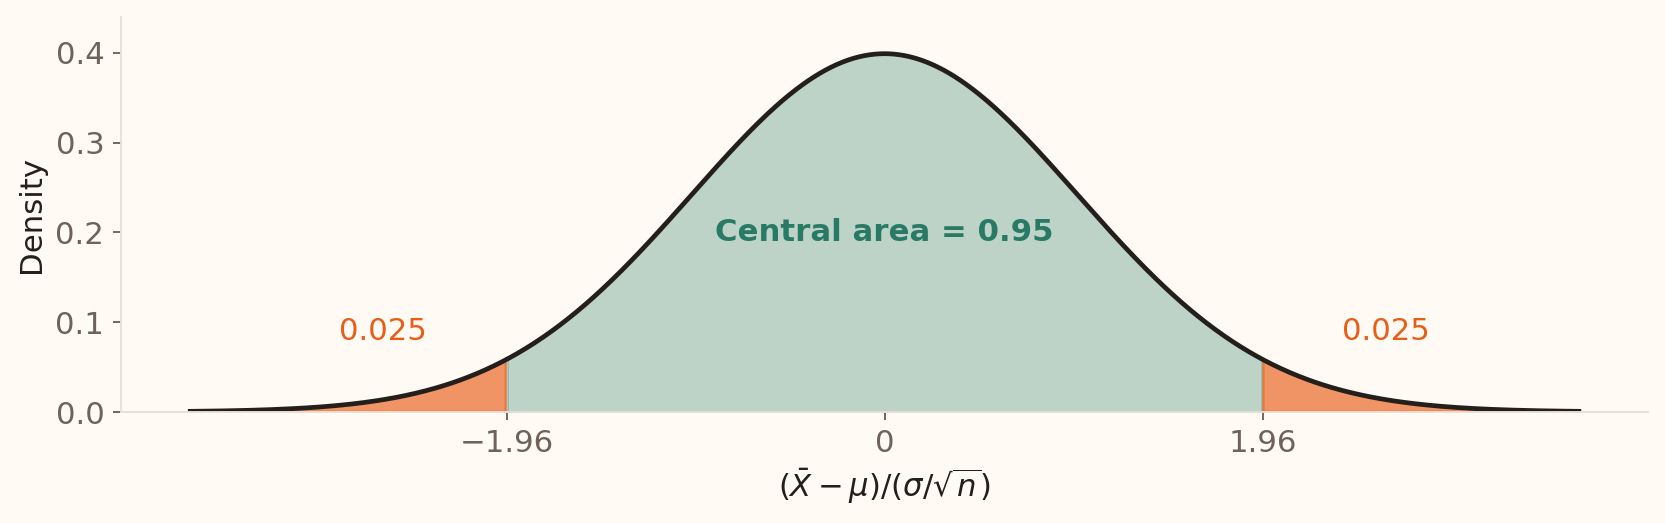
\[P\!\left(-1.96\le\frac{\bar X-\mu}{\sigma/\sqrt n}\le1.96\right)\approx0.95.\]
Split the remaining 5% equally between the two tails.
Rearrange the event to enclose the unknown mean
1. Start with the standardised distance: \[-z^*\le\frac{\bar X-\mu}{\sigma/\sqrt n}\le z^*.\]
2. Multiply by the standard error: \[-z^*\frac{\sigma}{\sqrt n}\le\bar X-\mu\le z^*\frac{\sigma}{\sqrt n}.\]
3. Rearrange to put \(\mu\) in the middle: \[\boxed{\bar X-z^*\frac{\sigma}{\sqrt n}\le\mu\le\bar X+z^*\frac{\sigma}{\sqrt n}}.\]
The endpoints vary across samples; the parameter stays fixed.
The interval template
\[\text{estimate}\ \pm\ \text{critical value}\times SE\]
| Component | Role |
|---|---|
| Estimate | Centre |
| Standard error | Sampling uncertainty |
| Critical value | Desired confidence |
Mean with known \(\sigma\)
When population standard deviation is known:
\[\bar X\pm z^*\frac{\sigma}{\sqrt n}\]
| Confidence | \(z^*\) |
|---|---|
| 90% | 1.645 |
| 95% | 1.960 |
| 99% | 2.576 |
Savings accounts: calculate an interval
A bank takes a random sample of 100 savings accounts.
\[\bar x=£1{,}500,\qquad \sigma=£300.\]
Assume independent observations and an adequate normal approximation for the sample mean.
- Calculate the standard error.
- Find the 95% margin of error.
- Write the interval and identify its population target.
Illustrative savings-account scenario. The population SD is assumed known for this exercise.
Savings accounts: work through the answer
1. Standard error: \[SE=\frac{300}{\sqrt{100}}=£30.\]
2. Margin of error: \[ME=1.96\times30=£58.80.\]
3. Confidence interval: \[1500\pm58.80=\boxed{(£1{,}441.20,\ £1{,}558.80)}.\]
The estimated population mean balance is £1,500, with a 95% confidence interval from £1,441.20 to £1,558.80.
Confidence is long-run coverage
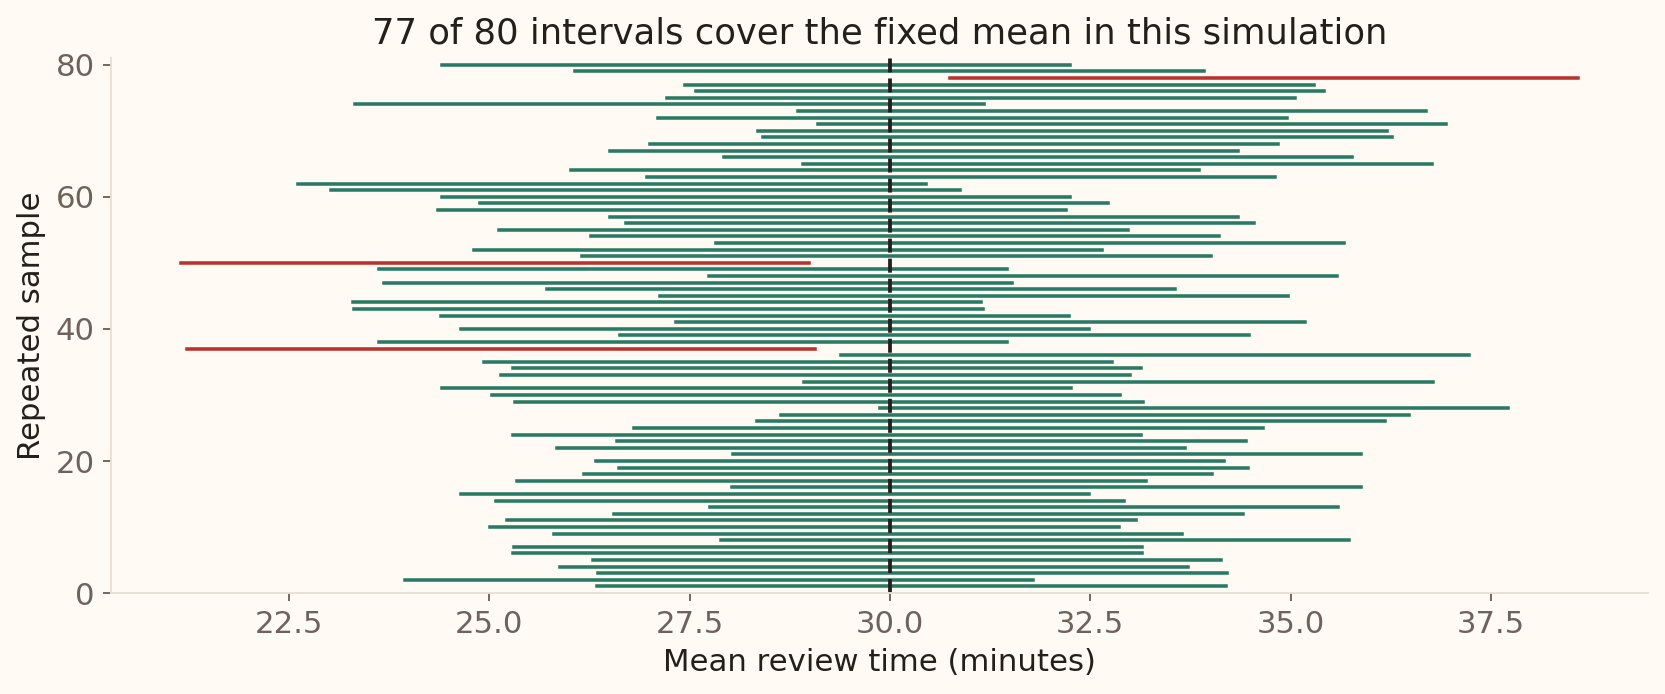
Over many repetitions, a 95% procedure covers the fixed parameter about 95% of the time.
Simulation: normal review times, mean 30 minutes, known SD 12, samples of 36, seed 202605. Finite runs need not give exactly 95% coverage.
Higher confidence gives a wider interval
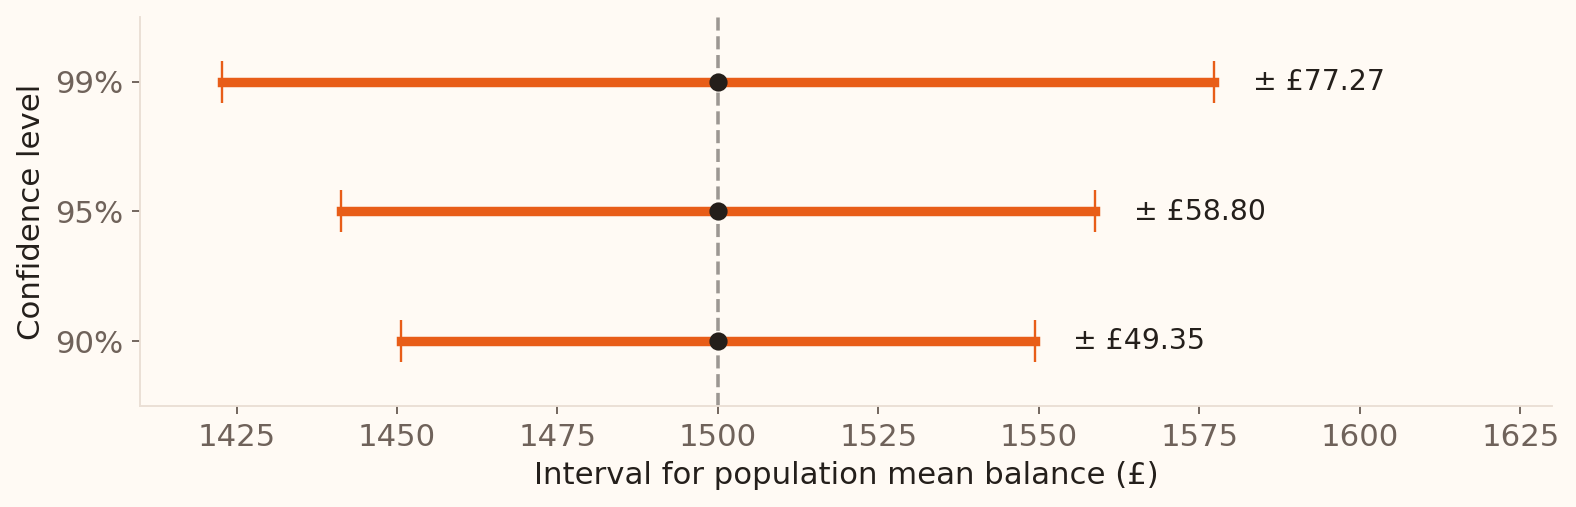
The sample and standard error stay the same. A larger critical value gives greater coverage and less precision.
Interpret 95% confidence
Which statement correctly describes a 95% confidence-interval procedure under its assumptions?
- 95% of individual account balances fall in the interval
- About 95% of intervals from repeated samples contain the fixed population mean
- The sample mean has a 95% chance of being correct
- The interval removes selection bias
Estimating the SD
When \(\sigma\) is unknown
Replace \(\sigma\) with sample SD \(s\) and use Student’s t distribution:
\[\bar X\pm t^*_{n-1}\frac{s}{\sqrt n}\]
The t distribution accounts for estimating \(\sigma\).
Why does estimating the SD change the distribution?
With independent normal observations:
\[Z=\frac{\bar X-\mu}{\sigma/\sqrt n}\sim N(0,1),\qquad T=\frac{\bar X-\mu}{S/\sqrt n}\sim t_{n-1}.\]
The estimated denominator changes from sample to sample, adding uncertainty.
Student’s t distribution allows for estimating the population SD from the same sample.
Why \(n-1\) degrees of freedom?
The deviations from the sample mean satisfy
\[\sum_{i=1}^{n}(x_i-\bar x)=0.\]
If three deviations are −2, +1, and ?, the last must be +1.
Once the mean is fitted, only \(n-1\) deviations can vary freely.
Normal versus t
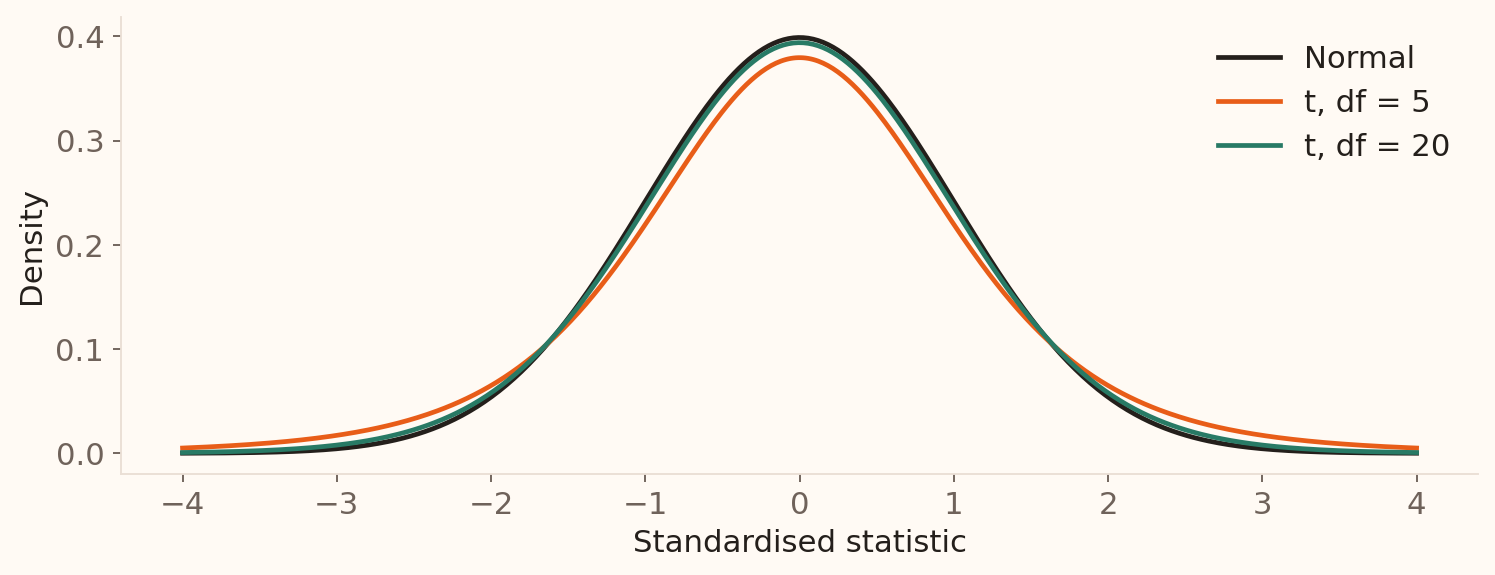
As \(df\) increases, \(t^*\) approaches the corresponding normal critical value.
Find a t critical value: row, column, cutoff
Each entry is a cutoff \(t^*\); the column heading gives the upper-tail probability \(P(T>t^*)\).
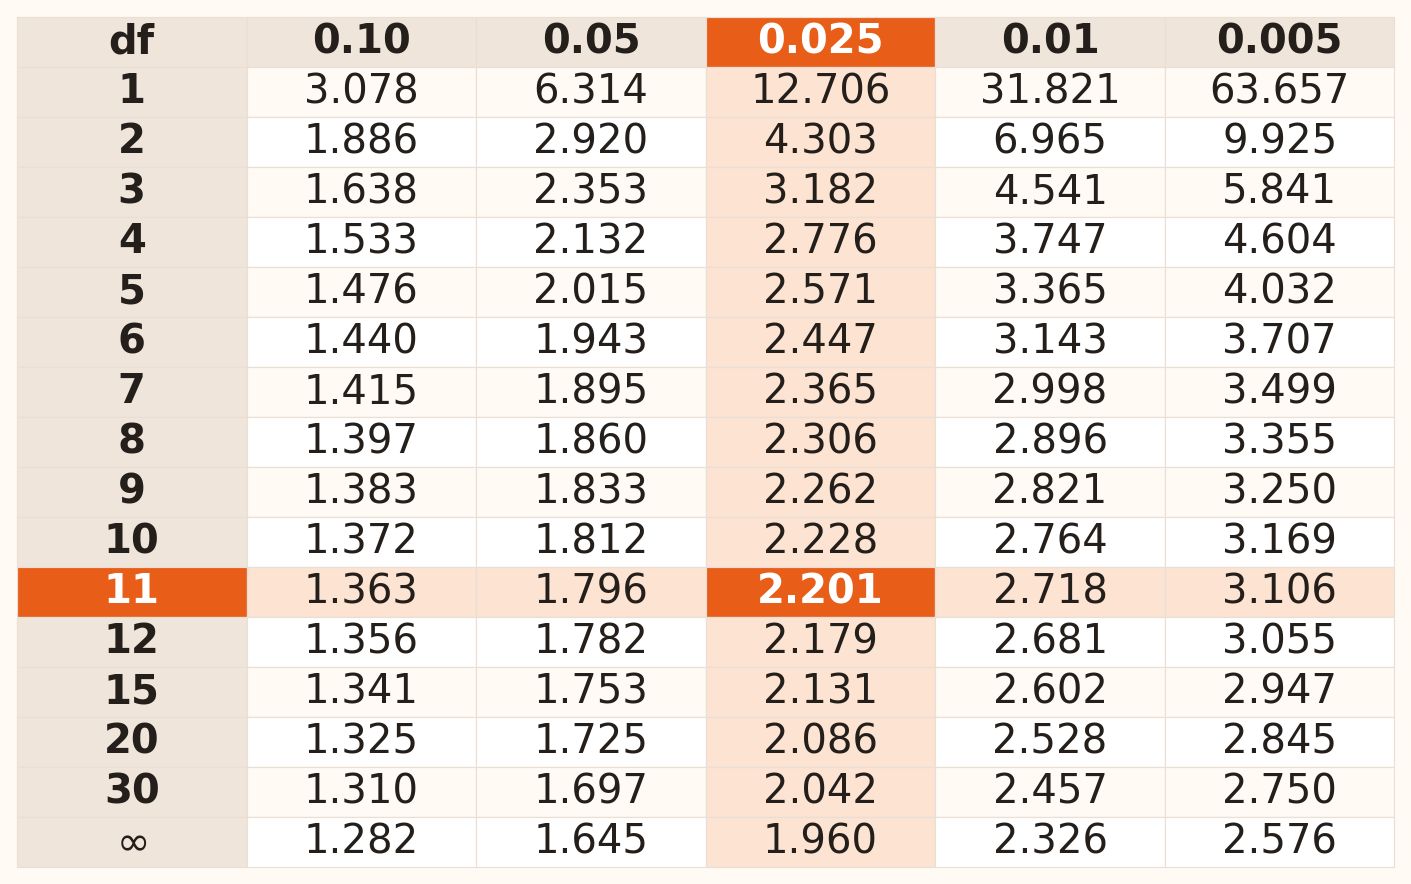
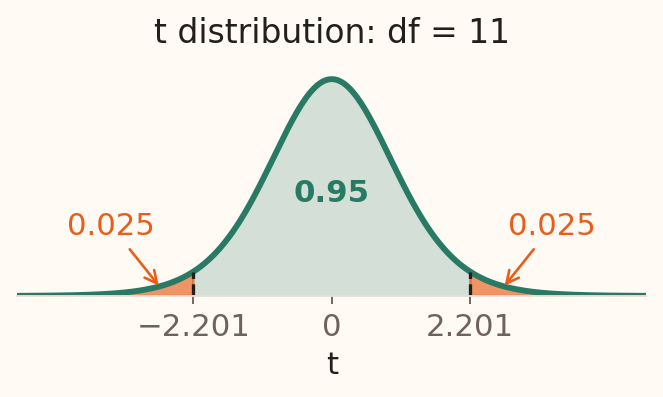
95% interval, \(n=12\):
- Row: \(df=12-1=11\).
- Column: \(0.05/2=0.025\).
- Read: \(t^*=\mathbf{2.201}\).
Selected rows; values rounded to three decimals. A cumulative table labels the same column 0.975; a two-sided confidence table labels it 95%.
A small sample of review times
An analyst randomly selects 12 independent loan reviews from a stable process.
\[\bar x=8\text{ minutes},\qquad s=4\text{ minutes}.\]
Assume the population of review times is approximately normal.
- Choose the reference distribution and degrees of freedom.
- Calculate a 95% interval for the mean review time.
- Explain why a small sample makes the shape assumption important.
Illustrative loan-review scenario.
Review times: calculate and interpret
1. Use Student’s t with \(df=12-1=11\): \(t^*=2.201\).
2. Calculate the standard error and margin: \[SE=\frac4{\sqrt{12}}=1.155,\qquad ME=2.201(1.155)=2.542.\]
3. Construct the interval: \[8\pm2.542=\boxed{(5.46,\ 10.54)\text{ minutes}}.\]
The interval estimates the population mean. Individual reviews can lie outside it.
Real campaign balances: \(\sigma\) unknown
Return to the opening 400-record sample: \(\bar x=€1{,}517.92\). Use the sample SD \(s=€2{,}842.26\) and \(df=399\):
\[SE=2842.26/\sqrt{400}=142.11\]
\[95\%\ CI=1517.92\pm1.966(142.11)\]
\[=(1238.53,1797.30).\]
Source: UCI Bank Marketing; reproducible 400-record sample, seed 11624. Strong balance skew makes the large sample important.
Choose normal or t: a practical guide
For a population mean, first ask whether the population SD is known.
| Information | Which critical value? |
|---|---|
| Population SD \(\sigma\) known | Use normal (\(z\)). |
| SD estimated by \(s\), with \(n<30\) | Use \(t\), with \(df=n-1\). |
| SD estimated by \(s\), with \(n\ge30\) | \(t\) remains the standard choice; normal is a rough shortcut as \(n\) grows. |
For 95% confidence, a quick large-sample calculation is estimate \(\pm\,2\times SE\).
Our examples: 12 reviews → \(t^*=2.201\); 400 balances → \(t^*=1.966\approx1.96\).
How large should the sample be? A rough guide
For a mean, assume random sampling and independent observations. Then check the population’s shape.
| Sample size | Practical guide |
|---|---|
| Below 15 | Use a small sample when the population is approximately normal, with no strong outliers. |
| 15–29 | Rough symmetry and no strong outliers can make the mean interval reasonable. |
| 30 or more | A normal approximation for the mean is often reasonable with moderate skewness. |
| Strong skew or outliers | 50 or more is a starting point; more data may be needed. |
12 reviews: the normality assumption matters. 400 balances: averaging helps with skewness.
Required sample size depends on the population; 30 or 50 observations do not guarantee accuracy.
Proportions & Precision
Interval for a proportion
A proportion is the fraction with a particular outcome: 800 satisfied customers out of 1,000 = 0.80 = 80%.
We use the sample proportion \(\hat p\) to estimate the population proportion \(p\).
\[\hat p\pm z^*\sqrt{\frac{\hat p(1-\hat p)}{n}}\]
For this normal approximation, check independence and at least 10 in each group: satisfied and not satisfied.
Customer satisfaction: estimate the rate
A random survey of 1,000 customers finds 800 satisfied.
\[\hat p=800/1000=0.80.\]
There are 800 successes and 200 failures, so both observed-count checks exceed 10.
Calculate: the standard error, then a 95% confidence interval for the population satisfaction rate.
Illustrative customer survey. Assume independent, representative responses and a small sampling fraction.
Customer satisfaction: work through the interval
1. Estimate the standard error: \[\widehat{SE}=\sqrt{\frac{0.80(0.20)}{1000}}=0.01265.\]
2. Find the margin and interval: \[ME=1.96(0.01265)=0.02479,\] \[0.80\pm0.02479=\boxed{(0.7752,\ 0.8248)}.\]
The estimated satisfaction rate is 80%, with an approximate 95% interval of 77.52% to 82.48%.
Interpret: the margin is 2.48 percentage points. Does this interval describe individual responses?
Precision means a smaller margin of error
Our customer survey gave 80% satisfied, with a 95% interval from 77.52% to 82.48%.
Estimate \(\pm\) margin of error: 80% \(\pm\) 2.48 percentage points.
The margin tells us how far the interval extends on either side of the estimate.
More precision means a smaller margin, keeping the confidence level fixed.
Discuss: which survey result is more precise: 80% \(\pm\) 5 points or 80% \(\pm\) 2.5 points?
How many responses for a useful percentage?
Suppose we want to estimate the percentage of satisfied customers with 95% confidence.
| Completed responses | Rough planning margin |
|---|---|
| 100 | \(\pm\) 10 percentage points |
| 400 | \(\pm\) 5 percentage points |
| 1,600 | \(\pm\) 2.5 percentage points |
To halve the margin, collect four times as many responses.
Approximate 95% planning guide: independent random responses, a small sampling fraction, and a conservative planning rate of 50% satisfied.
Precision is a design choice
| Change | Interval effect |
|---|---|
| Higher confidence | Wider |
| Larger sample | Narrower |
| More variability | Wider |
| Biased collection | Not repaired |
Statistical precision and data quality are different dimensions.
Plan a more precise survey
A survey uses 100 responses. Keeping confidence and the planning variability fixed, how many responses are needed to halve the margin of error?
- 150
- 200
- 400
- 800
Testing a Mean
Loan approvals: has the mean time changed?
A bank’s benchmark mean approval time is 5 days. After a process change, a random sample gives
\[n=36,\qquad\bar x=4.7\text{ days}.\]
For the first calculation, assume known \(\sigma=1.5\) days and a suitable normal sampling model.
The observed mean is 0.3 days below the benchmark. Is that difference large relative to sampling uncertainty?
Illustrative loan-approval scenario. The 5-day benchmark is treated as fixed.
Hypothesis testing
Hypothesis testing uses sample evidence to decide whether a statement about a population parameter should be rejected.
| Term | Meaning |
|---|---|
| Null hypothesis, \(H_0\) | A statement about the parameter that we use as the reference for the test. |
| Alternative hypothesis, \(H_A\) | The competing statement for which we seek evidence; it can be one-sided or two-sided. |
| Significance level, \(\alpha\) | A limit chosen in advance on the probability of rejecting a true \(H_0\). |
We use \(\alpha=0.05\) in the following examples.
Everyone can make a mistake
Suppose we test whether mean loan-approval time has fallen below 5 days:
\[H_0:\mu\ge5,\qquad H_A:\mu<5.\]
Random sampling can lead to either of two mistakes.
| Error | What happens in this example? |
|---|---|
| Type I: false alarm | We conclude that approvals are faster when the true mean is still 5 days or more. |
| Type II: missed improvement | We fail to detect a reduction when the true mean is below 5 days. |
An unusual sample can occur under a true null; a real change can be obscured by sampling variation.
Steps of hypothesis testing
- State the claim: identify the population parameter, \(H_0\) and \(H_A\); choose one or two tails.
- Plan the test: choose \(\alpha\), the sampling model and the test statistic; check the assumptions.
- Collect and calculate: obtain the sample and calculate the statistic.
- Make the comparison: use a critical value or a p-value.
- Report the conclusion: reject or fail to reject \(H_0\), and explain the estimated effect in context.
Choose the question, direction and significance level before examining the result.
Critical-value approach: the rejection region
A critical value marks the boundary of the rejection region under \(H_0\).
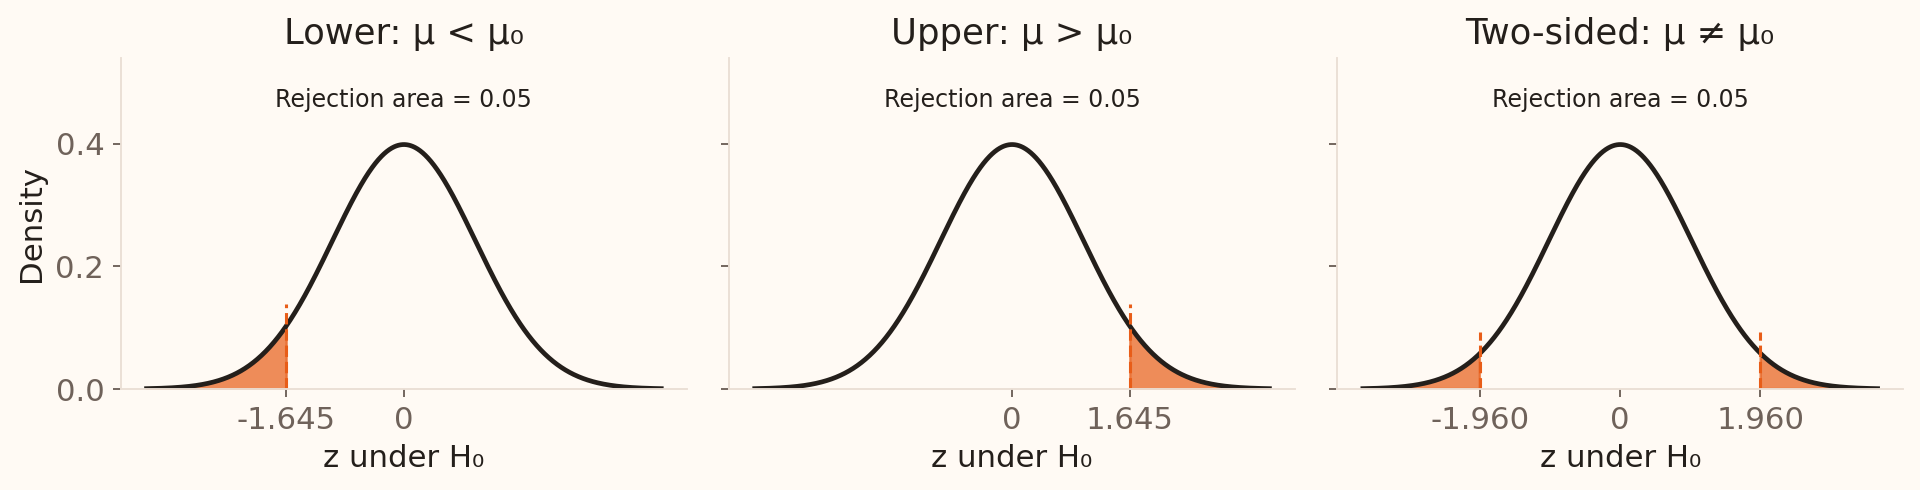
Reject \(H_0\) if the observed statistic falls in the shaded region.
At \(\alpha=0.05\), a two-sided test places 0.025 in each tail.
P-value approach
A p-value is the probability, under \(H_0\) and its assumptions, of a result at least as extreme as the observed result in the direction or directions specified by \(H_A\).
| Compare the p-value with \(\alpha\) | Decision |
|---|---|
| \(p\le\alpha\) | Reject \(H_0\). |
| \(p>\alpha\) | Fail to reject \(H_0\). |
Use this rule for both one-sided and two-sided tests. A two-sided p-value already includes both tails.
A small p-value indicates greater incompatibility between the data and the null model.
State the hypotheses before analysing the data
| Planned question | Null hypothesis | Alternative |
|---|---|---|
| Has mean time changed? | \(H_0:\mu=5\) | \(H_A:\mu\ne5\) |
| Has mean time fallen? | \(H_0:\mu\ge5\) | \(H_A:\mu<5\) |
| Has mean time increased? | \(H_0:\mu\le5\) | \(H_A:\mu>5\) |
Hypotheses describe the population mean. For the one-sided tests, calculate at the boundary \(\mu_0=5\).
Approval times: standardise the observed difference
1. Standard error under the benchmark model: \[SE_0=\frac{1.5}{\sqrt{36}}=0.25\text{ days}.\]
2. Test statistic: \[z=\frac{\bar x-\mu_0}{SE_0}=\frac{4.7-5}{0.25}=\boxed{-1.20}.\]
The observed mean is 1.2 standard errors below the benchmark.
For the planned decrease, \(-1.20>-1.645\): the statistic is outside the critical region, so fail to reject \(H_0\).
One observed result, two planned questions
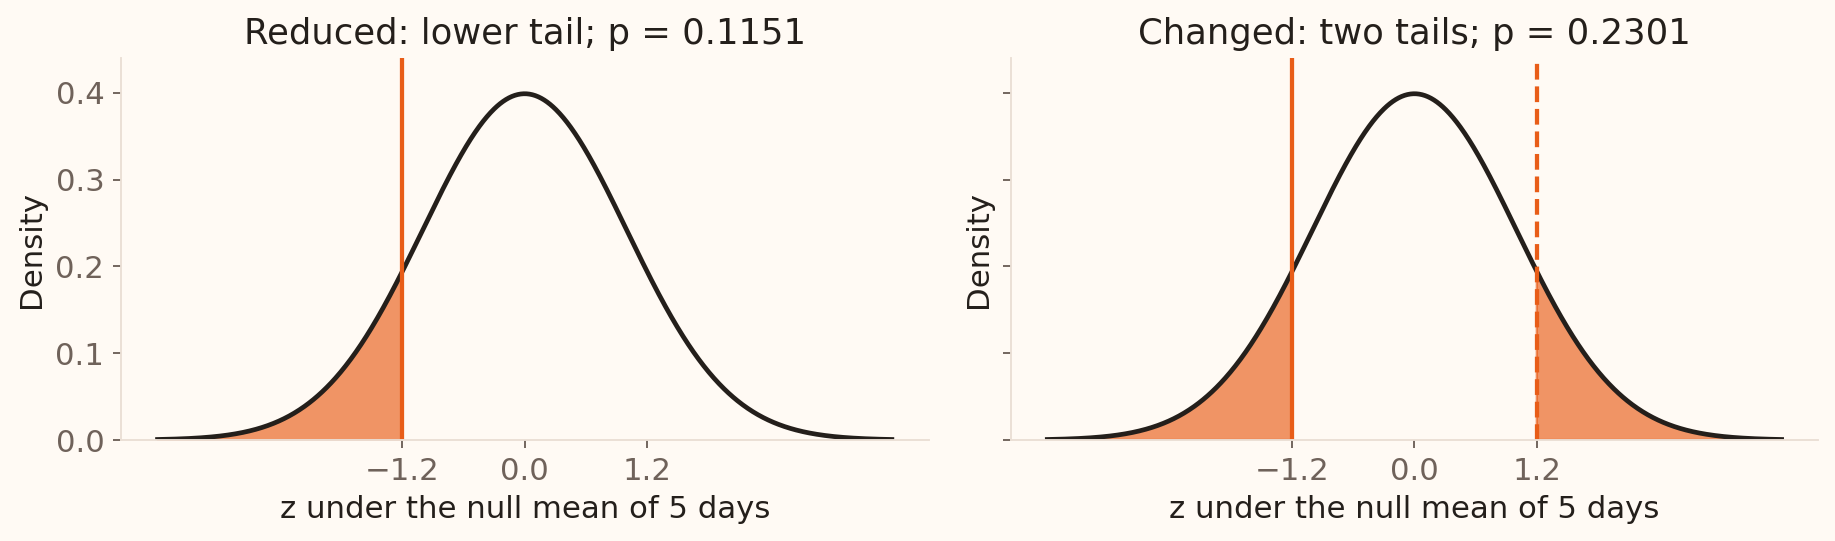
| Alternative | Probability under the null | p-value |
|---|---|---|
| \(\mu<5\) | \(P(Z\le-1.20)\) | 0.1151 |
| \(\mu\ne5\) | \(P(|Z|\ge1.20)\) | 0.2301 |
Approval times: compare both approaches
Our observed statistic is \(z=-1.20\). Use \(\alpha=0.05\).
| Planned question | Critical-value check | P-value check | Decision |
|---|---|---|---|
| Has the mean fallen? | \(-1.20>-1.645\) | \(0.1151>0.05\) | Fail to reject |
| Has the mean changed? | \(-1.960<-1.20<1.960\) | \(0.2301>0.05\) | Fail to reject |
The two approaches agree for each planned question.
Conclusion for the planned decrease: the estimated mean is 0.3 days lower, with insufficient evidence of a lower population mean at the 5% level.
What changes when the SD is estimated?
Suppose 1.5 days is the sample SD \(s\), rather than a known population SD.
\[t=\frac{4.7-5}{1.5/\sqrt{36}}=-1.20,\qquad df=35.\]
| Quantity | Known \(\sigma\): normal | Estimated \(\sigma\): t with 35 df |
|---|---|---|
| Lower-tail p-value | 0.1151 | 0.1191 |
| Lower critical value at 5% | −1.645 | −1.690 |
The numerical statistic stays the same; the reference distribution changes.
Confidence interval versus hypothesis test
| Aspect | Confidence interval | Hypothesis test |
|---|---|---|
| Question | Which parameter values are plausible? | Is there evidence against a specified claim? |
| Result | A range with a confidence level | A test statistic, p-value and decision |
| Chosen level | For example, 95% confidence | For example, 5% significance |
| Approval-time example | Mean time: 4.21–5.19 days | Test \(\mu=5\): two-sided \(p=0.2301\) |
The interval shows the size and uncertainty of the effect; the test assesses a specified benchmark.
Use a confidence interval to test a mean
For \(H_0:\mu=5\) versus \(H_A:\mu\ne5\) at 5% significance, calculate the matching 95% confidence interval:
\[4.7\pm1.96(0.25)=\boxed{(4.21,\ 5.19)\text{ days}}.\]
| Where is the null value? | Decision using the interval |
|---|---|
| Outside the interval | Reject \(H_0\). |
| Inside the interval | Fail to reject \(H_0\). |
5 days lies inside, so fail to reject \(H_0\): the same decision as the two-sided test with \(p=0.2301\).
Testing a Proportion
Case: default-rate threshold
The UCI credit dataset records 6,636 next-month defaults among 30,000 accounts:
\[\hat p=6636/30000=0.2212.\]
Use 20% as a teaching risk-monitoring threshold.
Could sampling variation under a 20% default model plausibly explain the observed 22.12%?
Source: Yeh, UCI Default of Credit Card Clients. The 20% threshold is illustrative, not a published policy limit.
Why the test uses \(p_0\) in its standard error
Week 4 gave \(SE(\hat p)=\sqrt{p(1-p)/n}\) under independent Bernoulli sampling.
| Task | Rate used in the standard error |
|---|---|
| Estimate an unknown rate with an interval | \(\hat p\): estimate the unknown variability |
| Test a specified rate \(H_0:p=p_0\) | \(p_0\): calculate variability under the null |
For \(p_0=0.20\) and \(n=30{,}000\), check \(np_0=6{,}000\) and \(n(1-p_0)=24{,}000\).
Testing a default-rate benchmark
| Hypothesis | Role |
|---|---|
| \(H_0:p=0.20\) | Benchmark model used for calculation |
| \(H_A:p>0.20\) | Direction of the suspected departure |
\[z=\frac{\hat p-p_0}{\sqrt{p_0(1-p_0)/n}} =\frac{0.2212-0.20}{\sqrt{0.20(0.80)/30000}}=9.18.\]
The observed proportion is 9.18 null standard errors above the benchmark.
Default-rate test: calculate the tail probability
For the one-sided alternative,
\[p\text{-value}=P(Z\ge9.18\mid H_0)\approx2.2\times10^{-20}.\]
Under the benchmark model, a proportion at least this high would be extraordinarily unusual.
Default-rate test: report the finding
| Result | Statistical decision |
|---|---|
| \(p\le\alpha\) | Reject \(H_0\) |
| \(p>\alpha\) | Fail to reject \(H_0\) |
With \(p\ll0.05\), reject \(H_0\). The practical difference is 2.12 percentage points.
“Fail to reject” is not “prove true”.
Because the 30,000 records are the published dataset rather than a documented probability sample, the p-value is model-based. The observed 22.12% remains descriptive fact for this dataset.
Read a p-value correctly
A prespecified test gives p = 0.03. What does this mean under the test assumptions?
- The null hypothesis has a 3% chance of being true
- Under the null, a statistic at least as extreme has probability 3%
- The effect is 3%
- The study is correct with probability 97%
When it comes to real data
Start with the research question and the observational unit.
| Step | What should you establish? |
|---|---|
| Understand the data | Target population, sample size, missing values, repeated observations and distribution shape. |
| State the hypotheses | Mean or proportion? What benchmark? One or two tails? Choose \(\alpha\) in advance. |
| Choose and calculate | Mean: \(z\) if \(\sigma\) is known, otherwise \(t\). Proportion: check counts before a normal approximation. |
| Make the comparison | Statistic versus critical value; p-value versus \(\alpha\); or null value versus a matching confidence interval. |
| Report in context | Estimate, interval, p-value, decision, assumptions and practical importance. |
Session 5 takeaway
- Judge an estimator by its bias, precision and behaviour as the sample grows.
- Build an interval from an estimate, standard error and critical value.
- Confidence describes repeated-sampling coverage.
- Recognise false alarms and missed signals when making testing decisions.
- Use critical values, p-values or a matching interval to assess a planned hypothesis.
- Report the estimated effect, uncertainty and practical meaning.
Next: apply these procedures to real data and paired differences, then examine errors, power and practical consequences.