Statistics for Analytics
Session 6: One-Sample & Paired Inference

Today’s route
Choose the observational unit, test the claim and report the size and uncertainty of the effect.
One-Sample Procedures
From a benchmark to a procedure
Session 5 constructed confidence intervals and carried out one-sample z and t tests.
Today we apply that workflow to real records, then analyse paired changes and the consequences of testing errors.
| Question | Parameter |
|---|---|
| Has mean balance increased? | Mean balance \(\mu\) |
| Has the subscription rate fallen? | Proportion \(p\) |
| Have the same clients’ bills changed? | Mean within-client difference \(\mu_d\) |
Choose the parameter and the observational unit before calculating.
Practice: plan the balance test
The Week 5 sample gave
\[n=400,\qquad\bar x=€1{,}517.92,\qquad s=€2{,}842.26.\]
The planned question is whether the mean balance exceeds €1,250.
- State the null and alternative hypotheses.
- Choose the reference distribution and standard error.
- Predict which tail supplies the p-value.
UCI Bank Marketing; sample seed 11624. The benchmark is illustrative.
Balance test: choose the sampling model
The population SD is estimated from the sample, so use
\[t=\frac{\bar x-\mu_0}{s/\sqrt n},\qquad df=n-1=399.\]
Check: random selection, the sampling fraction, balance skewness and extreme observations.
Real balance sample
A reproducible sample from the bank campaign records gives
\[n=400,\quad\bar x=€1517.92,\quad s=€2842.26.\]
Test \(H_0:\mu=€1250\) versus \(H_A:\mu>€1250\).
\[t=\frac{1517.92-1250}{2842.26/\sqrt{400}}=1.89,\quad df=399.\]
Source: UCI Bank Marketing; sample seed 11624. The €1,250 benchmark is illustrative.
Balance-test conclusion
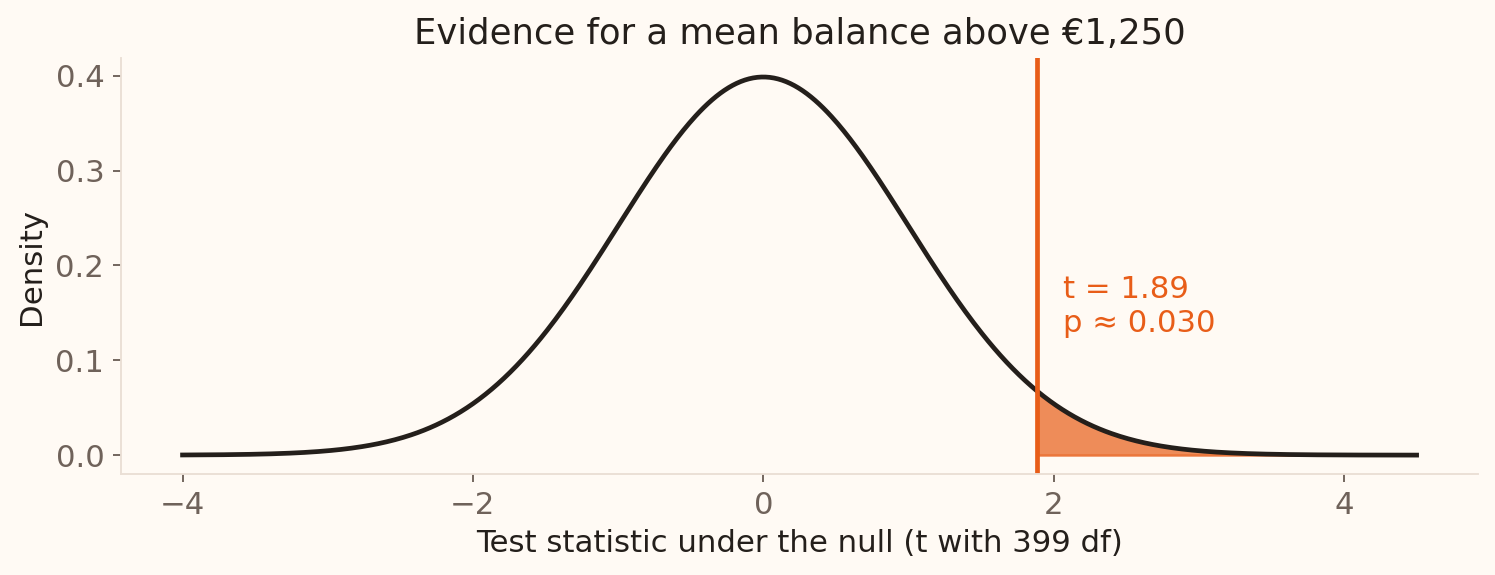
Conclusion: the approximate test supports a mean above €1,250. The estimated excess is €267.92.
Campaign-rate example
In the reproducible sample of 400 campaign records, 30 clients subscribed. Compare with a 10% historical benchmark.
Test \(H_0:p\ge0.10\) versus \(H_A:p<0.10\).
\[\hat p=30/400=0.075\]
\[z=\frac{0.075-0.10}{\sqrt{0.10(0.90)/400}}=-1.67.\]
For \(H_A:p<0.10\), \(p\approx0.048\).
The estimated shortfall is 2.5 percentage points; the approximate result is close to the 5% threshold.
Source: UCI Bank Marketing; sample seed 11624. The 10% benchmark is illustrative.
The same count: approximate or exact?
Under \(H_0:p=0.10\), the subscription count satisfies \(X\sim\operatorname{Bin}(400,0.10)\).
| Method for the planned decrease | Lower-tail probability | Decision at 5% |
|---|---|---|
| Normal z approximation | 0.0478 | Reject |
| Exact binomial: \(P(X\le30)\) | 0.0524 | Fail to reject |
The estimate is 7.5% under either method, a shortfall of 2.5 percentage points.
Campaign rate: report the method and the evidence
“The observed subscription rate was 7.5%, compared with the 10% benchmark. The exact lower-tail binomial test gave p = 0.0524, which exceeds the prespecified 5% level.”
What additional information would help assess whether the 2.5-point shortfall warrants action?
Paired Differences
When data are paired
Repeated measures
Before and after on the same unit
Natural matching
Matched branches with similar portfolios
Pairing is useful when members of a pair are similar.
Choose the unit of analysis
The same 150 borrowers have August and September bills. Which analysis addresses their mean monthly change?
- An independent test with 300 observations
- A paired analysis of 150 within-borrower differences
- A two-proportion test
- Treat every bill as an independent borrower
Analyse within-pair differences
For each complete pair, define \(d_i=x_{i,\text{after}}-x_{i,\text{before}}\).
Then perform a one-sample t procedure on \(d_1,\ldots,d_n\).
| Task | Calculation |
|---|---|
| Confidence interval | \(\bar d\pm t^*_{n-1}s_d/\sqrt n\) |
| Test \(H_0:\mu_d=0\) | \(t=\bar d/(s_d/\sqrt n)\), with \(df=n-1\) |
The sample size is the number of complete pairs; \(s_d\) is the SD of their differences.
The same clients in two months
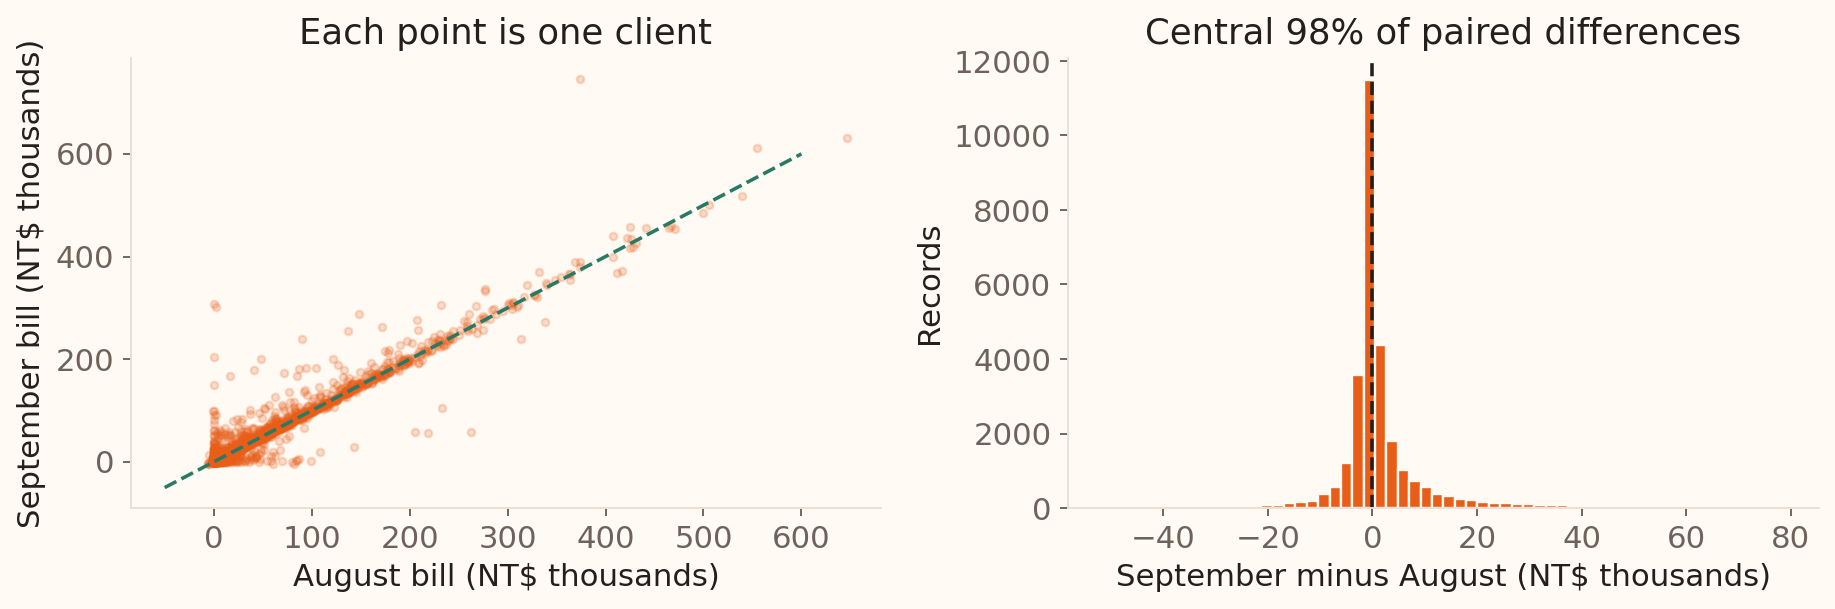
The comparison uses each client’s change, preserving the link between their two bills.
UCI Default of Credit Card Clients. Scatter: 2,500 sampled clients; histogram: central 98% of differences. Calculations use all 30,000 pairs.
Paired monthly bills
For the same 30,000 accounts, define \(d=\) September bill − August bill.
\[\bar d=2044.26\ \mathrm{NTD},\quad s_d=22684.89\ \mathrm{NTD}.\]
\[t=15.61,\quad df=29{,}999,\]
with a 95% interval of 1,788 to 2,301 NTD for the mean within-record change.
Source: UCI Default of Credit Card Clients, BILL_AMT1 and BILL_AMT2. Time dependence and collection context limit wider inference.
Errors & Power
Truth table: false alarms, missed signals and power
A risk team tests whether the default rate exceeds 20%. Compare two possible population rates.
| Our decision | True rate is 20% | True rate is 22% |
|---|---|---|
| Reject \(H_0\) | Type I: false alarm, probability \(\alpha\) | Correct detection, probability \(1-\beta\) |
| Fail to reject \(H_0\) | Correct decision, probability \(1-\alpha\) | Type II: missed increase, probability \(\beta\) |
Power \(=1-\beta\) is the probability of detecting the specified increase to 22%.
Choosing \(\alpha=0.05\) does not set \(\beta\): detection also depends on sample size, variability and the true change.
Which error is more costly here?
A risk team tests whether the portfolio default rate exceeds its benchmark.
- A false alarm triggers an expensive review.
- A missed increase delays action on a deteriorating portfolio.
Discuss how lowering the significance level changes these risks at a fixed sample size. How could the team improve detection without increasing the false-alarm rate?
What increases power?
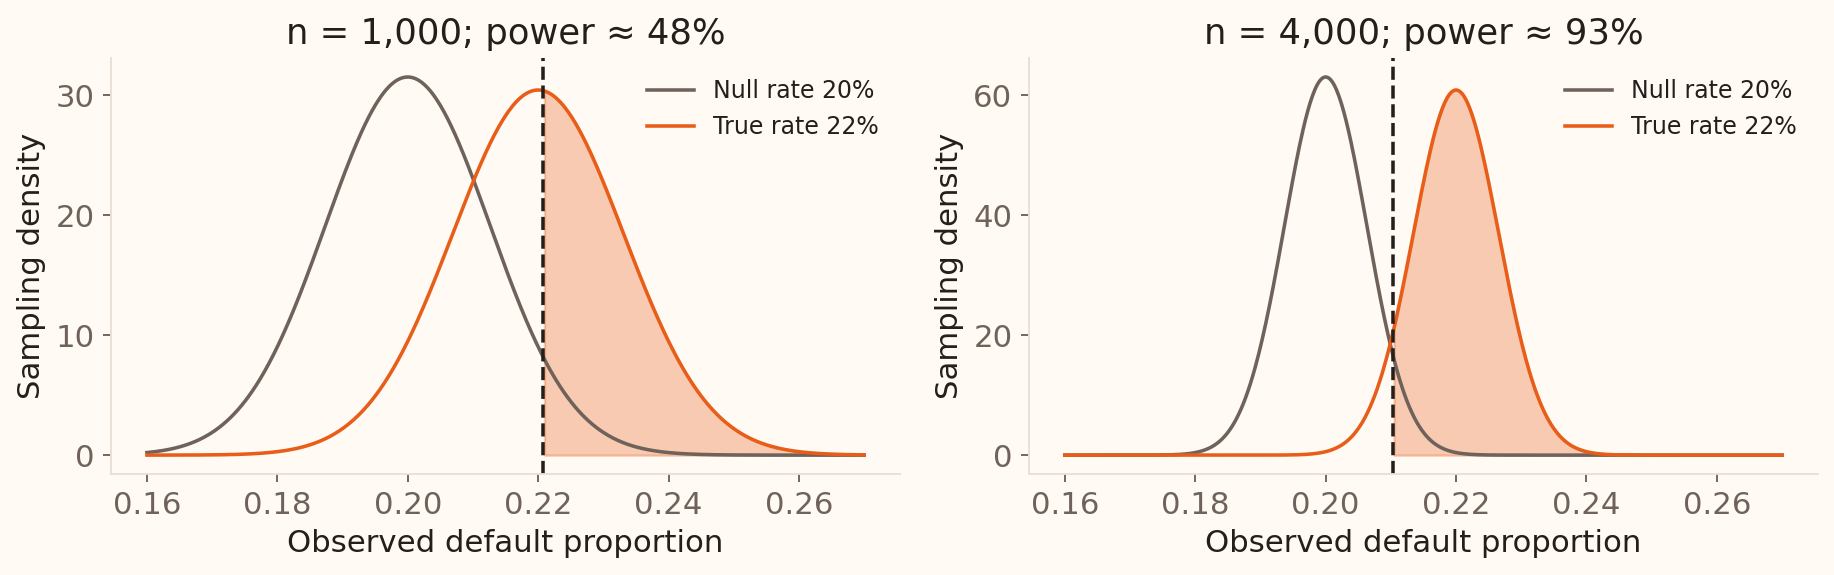
Larger samples, larger effects, and lower variability improve power. Raising \(\alpha\) also increases false alarms.
Illustrative normal approximations: one-sided test at \(\alpha=0.05\), null rate 0.20, alternative rate 0.22. Orange shaded area is power.
Significance is not importance
| Question | Tool |
|---|---|
| Is evidence inconsistent with \(H_0\)? | p-value |
| How large is the effect? | Point estimate |
| How precise is it? | Confidence interval |
| Does it matter operationally? | Domain threshold |
A good report answers all four.
Reporting Evidence
The same sample, two planned questions
The balance sample gives \(t=1.885\) against €1,250, with \(df=399\).
| Planned alternative | p-value |
|---|---|
| Mean above €1,250 | 0.030 |
| Mean different from €1,250 | ? |
The matching two-sided 95% interval is €1,238.53 to €1,797.30.
Explain the two decisions at 5% and their agreement with the interval.
Would this change a risk decision?
A portfolio test gives p = 0.03, but the estimated reduction in default is only 0.1 percentage point. What can you conclude, and what else would you need before acting?
Session 6 takeaway
- Use one-sample procedures for a mean, a proportion or paired differences.
- Choose the direction of a test before seeing its result.
- Distinguish false alarms, missed signals and practical importance.
- Report the effect, interval, assumptions and conclusion together.
Next: compare independent groups and categorical outcomes.
Reference
Pairing reduces noise
\[\operatorname{Var}(X-Y)= \operatorname{Var}(X)+\operatorname{Var}(Y)-2\operatorname{Cov}(X,Y)\]
Positive within-pair correlation reduces variation in differences and can improve precision.
Keep the pairs intact: analysing the two columns as independent groups uses a different standard error.
Multiple testing
If 20 independent true null hypotheses are tested at \(\alpha=0.05\),
\[P(\text{at least one false positive})=1-0.95^{20}\approx0.64.\]
Pre-specify primary outcomes and adjust when many comparisons are explored.