Statistics for Analytics
Session 7: Comparing Groups & Categorical Outcomes

Today’s route
Match the method to the design, then explain the size and pattern of a group difference.
Independent Means
A real credit-risk comparison
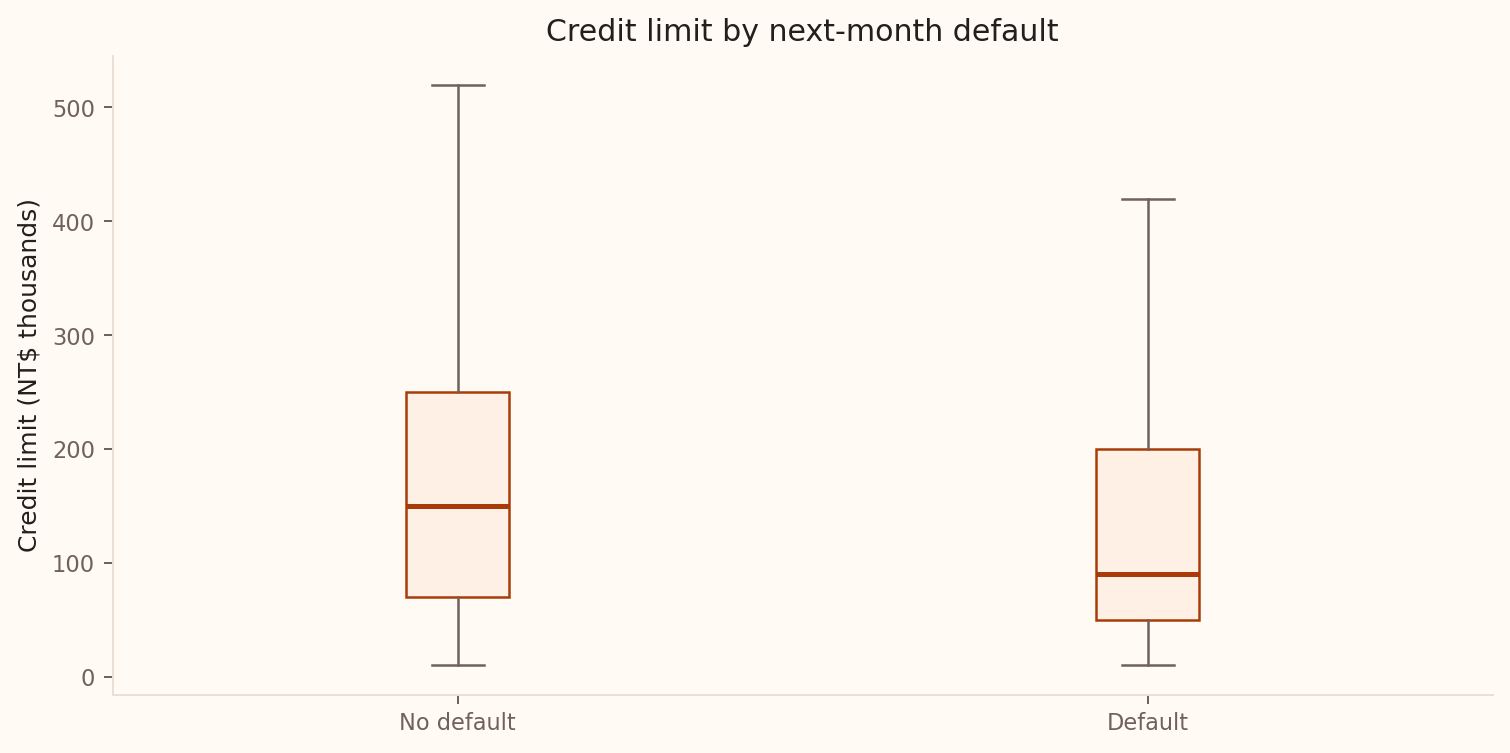
How large is the difference in mean credit limit between the two outcome groups?
Source: Yeh, UCI Default of Credit Card Clients. Groups are observational; outlier marks are hidden in the plot, not removed from calculations.
Parameter and estimate
\[\text{parameter: }\mu_1-\mu_2 \qquad \text{estimate: }\bar x_1-\bar x_2\]
The sign depends on the chosen order. Define Group 1 and Group 2 before calculating.
Welch two-sample test
For \(H_0:\mu_1-\mu_2=\Delta_0\):
\[SE=\sqrt{\frac{s_1^2}{n_1}+\frac{s_2^2}{n_2}},\]
\[t=\frac{(\bar x_1-\bar x_2)-\Delta_0}{SE}\]
Software calculates Welch–Satterthwaite degrees of freedom. Usually \(\Delta_0=0\).
The matching confidence interval is \((\bar x_1-\bar x_2)\pm t^*SE\).
Conditions
Independent groups
No unit in both
Independent within
Representative samples
Shape
Normal or large \(n\)
No extremes
At small \(n\)
Credit-limit summaries
Let Group 1 be no next-month default and Group 2 be default.
| Outcome | \(n\) | Mean limit (NTD 000) | SD (NTD 000) |
|---|---|---|---|
| No default | 23,364 | 178.10 | 131.63 |
| Default | 6,636 | 130.11 | 115.38 |
Difference estimate: \(178.10-130.11=47.99\) thousand NTD.
Source: UCI Default of Credit Card Clients; all 30,000 records.
Build the comparison before reading the result
For no-default versus default records, the mean limits are 178.10 and 130.11 thousand NTD.
The Welch standard error of their difference is 1.658 thousand NTD.
- Estimate the difference and an approximate 95% interval using \(1.96\times SE\).
- State which group’s mean is higher.
- Explain whether the comparison establishes a lending-policy effect.
Credit-limit comparison: the finding
\[H_0:\mu_1-\mu_2=0\qquad H_A:\mu_1-\mu_2\ne0\]
Welch’s test gives approximately
\[t=28.95,\qquad df\approx11{,}982.\]
\[p<.001.\]
Mean credit limit is 47.99 thousand NTD higher in the no-default group; the model-based 95% interval is 44.74 to 51.24 thousand NTD.
This compares observed groups. A lending intervention requires a different design.
Two Proportions
Comparing rates
| Group | Successes | Total | Sample proportion |
|---|---|---|---|
| Cellular | 4,369 | 29,285 | .1492 |
| Telephone | 390 | 2,906 | .1342 |
Parameter: \(p_1-p_2\). Estimate: 1.50 percentage points, revisiting Week 1’s comparison.
Source: UCI Bank Marketing. “Success” is term-deposit subscription; this is an observational comparison.
Test of equal proportions
Under \(H_0:p_1=p_2\), pool the proportions:
\[\hat p_{pool}=\frac{x_1+x_2}{n_1+n_2}.\]
\[z=\frac{\hat p_1-\hat p_2} {\sqrt{\hat p_{pool}(1-\hat p_{pool})(1/n_1+1/n_2)}}.\]
Check independence within and between groups, and adequate expected successes and failures in each group.
Why pool only for the test?
Test
\(H_0\) says the proportions are equal, so one pooled estimate is coherent.
Interval
Does not assume equality, so keep separate estimates.
For the confidence interval, use
\[(\hat p_1-\hat p_2)\pm z^*\sqrt{\frac{\hat p_1(1-\hat p_1)}{n_1}+\frac{\hat p_2(1-\hat p_2)}{n_2}}.\]
Subscription-rate result
For 4,369/29,285 versus 390/2,906:
\[\hat p_{pool}=4759/32191=.1478,\qquad z=2.17,\qquad p=.030.\]
The estimated difference is 1.50 percentage points, with a 95% interval of 0.19 to 2.80 percentage points.
Next step: compare contact methods in a randomised campaign to assess their causal effect.
What does the channel comparison establish?
The cellular minus telephone subscription difference is 1.50 percentage points, with a model-based 95% interval from 0.19 to 2.80. Which conclusion is supported?
- Switching every client to cellular will cause a 1.50-point increase
- The recorded groups differ; a randomised comparison could test a channel effect
- Every cellular client is more likely to subscribe
- The interval contains 95% of individual clients
Categorical Association
Contact method and subscription
The real campaign data cross-classify last contact method and term-deposit outcome.
| Contact | No | Yes | Total |
|---|---|---|---|
| Cellular | 24,916 | 4,369 | 29,285 |
| Telephone | 2,516 | 390 | 2,906 |
| Unknown | 12,490 | 530 | 13,020 |
| Total | 39,922 | 5,289 | 45,211 |
Source: Moro, Rita & Cortez, UCI Bank Marketing. “Unknown” is an observed category, not missing-row deletion.
What independence predicts
| Hypothesis | Claim about contact method and subscription |
|---|---|
| \(H_0\) | Independent |
| \(H_A\) | Associated |
If \(H_0\) holds,
\[E_{ij}=\frac{(\text{row total})(\text{column total})}{n}\]
For Cellular × Yes:
\[E=29285\times5289/45211=3425.90.\]
Calculate one expected cell
Under independence, all contact groups share the overall subscription rate.
There are 13,020 unknown-method records, 5,289 subscriptions and 45,211 records in total.
- Calculate the expected number of subscriptions in the unknown-method group.
- Compare it with the observed 530.
- Predict the sign of its Pearson residual and its contribution to \(\chi^2\).
Cell contributions
\[\chi^2=\sum\frac{(O-E)^2}{E}\]
| Contact | No | Yes |
|---|---|---|
| Cellular | 34.40 | 259.62 |
| Telephone | 0.98 | 7.37 |
| Unknown | 85.79 | 647.56 |
\[\chi^2=1035.71,\qquad df=(r-1)(c-1)=2.\]
Large values mean observed counts are far from independence.
Decision and interpretation
1035.71
Observed \(\chi^2\)
2
Degrees of freedom
\(<.001\)
p-value
At \(\alpha=.05\), the critical value is 5.991. Reject independence: contact method and subscription are associated.
Which cells drive the result?
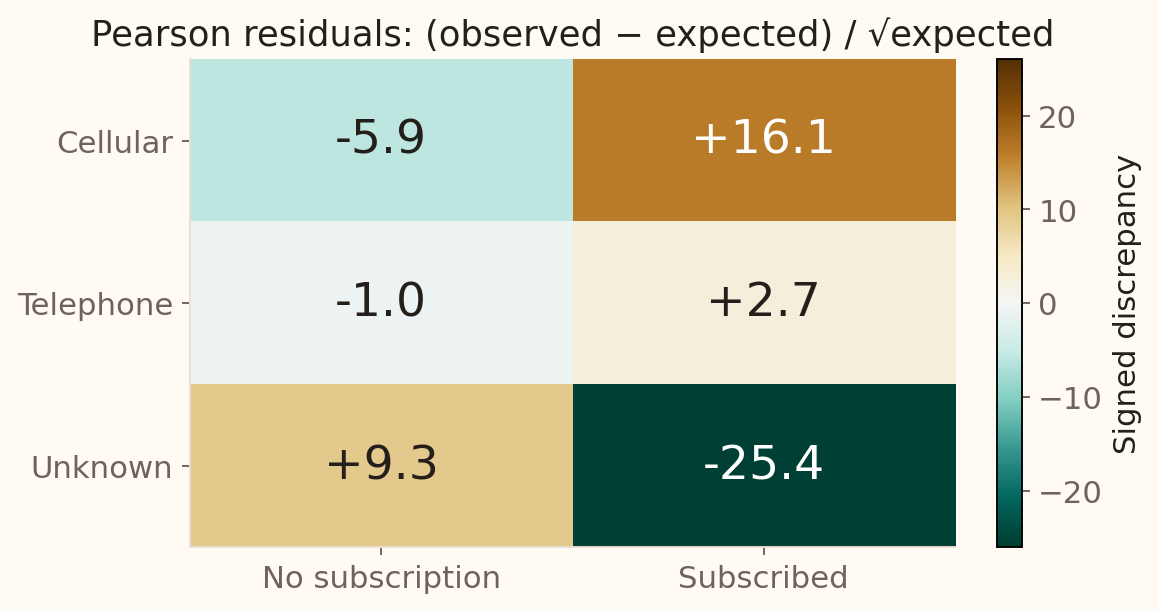
Next step: investigate the unknown-method group and differences in customer mix before changing campaign policy.
UCI Bank Marketing. Squaring and summing these Pearson residuals gives the chi-square statistic.
Conditions
Counts
Not percentages
Independent
One cell per unit
Expected
All at least 5 here
Representative
Valid sampling
Strength, not only significance
For an \(r\times c\) table, Cramér’s V is
\[V=\sqrt{\frac{\chi^2}{n\min(r-1,c-1)}}.\]
For these data,
\[V=\sqrt{1035.71/(45211\times1)}=.151.\]
This quantifies association strength on a 0–1 scale.
Benchmarks & Method Choice
One variable, specified distribution
Goodness of fit compares observed category counts with proportions specified by \(H_0\).
\[H_0:p_1=p_{1,0},\ldots,p_k=p_{k,0}\]
\[E_i=np_{i,0},\qquad df=k-1-m,\]
where \(m\) parameters were estimated from the data.
Account preferences: a planning check
An illustrative survey of 300 customers is compared with a prespecified account-preference mix.
| Account type | Observed | Planned share | Expected |
|---|---|---|---|
| Savings | 140 | 50% | 150 |
| Current | 90 | 30% | 90 |
| Investment | 70 | 20% | 60 |
\[\chi^2=\frac{(140-150)^2}{150}+0+\frac{(70-60)^2}{60}=2.33.\]
With \(df=2\), \(p=.311\): insufficient evidence that preferences differ from the plan.
Illustrative example. The benchmark must be set before inspecting the survey results.
Choose the categorical test
| Question | Test | Example |
|---|---|---|
| Are two variables related in one population? | Association | Contact method and subscription |
| Does one distribution match a benchmark? | Goodness of fit | Account preferences versus the plan |
| Is a distribution shared across populations? | Homogeneity | Account preferences in three regions |
All compare observed counts with expected counts under the null.
Choose the categorical test
Match these questions: contact method and subscription in one customer sample; account preferences against a 50/30/20 benchmark; account preferences in separate samples from three regions.
A compact decision map
| Outcome | Design | Procedure |
|---|---|---|
| Numerical | Two independent groups | Welch two-sample t |
| Numerical | Paired observations | One-sample t on differences |
| Binary | Two independent groups | Two-proportion z |
| Categorical | Two variables in one sample | Chi-square association |
| Categorical | One variable versus specified shares | Chi-square goodness of fit |
Ask about outcome type and study design before choosing a formula.
Session 7 takeaway
- Use Welch inference for independent means and preserve the group order.
- Use the null model to choose the test standard error.
- Chi-square tests compare observed counts with expected counts.
- Explain the pattern and effect size as well as the global p-value.
Next: compare several means and fit a line to a numerical outcome.
Reference
When both population SDs are known
\[SE=\sqrt{\frac{\sigma_1^2}{n_1}+\frac{\sigma_2^2}{n_2}},\qquad z=\frac{(\bar x_1-\bar x_2)-\Delta_0}{SE}.\]
Illustrative loan processing times:
| Process | \(n\) | Mean (days) | Known SD (days) |
|---|---|---|---|
| A | 50 | 7.0 | 2.0 |
| B | 60 | 6.5 | 2.5 |
Difference \(=.5\) day; \(SE=.429\); 95% interval \(=(-.34,1.34)\) days.
Why not pool automatically?
The pooled t-test assumes \(\sigma_1^2=\sigma_2^2\).
| Situation | Preferred approach |
|---|---|
| Variances may differ | Welch t |
| Strong equal-variance justification | Pooled t |
| Severe skew or extremes | Transform, robust, or randomisation method |
Relative measures
| Measure | Estimate | Interpretation |
|---|---|---|
| Rate difference | \(\hat p_1-\hat p_2=.0150\) | +1.50 percentage points |
| Rate ratio | \(\hat p_1/\hat p_2=1.11\) | About 11% higher rate |
| Odds ratio | \(\frac{\hat p_1/(1-\hat p_1)}{\hat p_2/(1-\hat p_2)}=1.13\) | About 13% higher odds |
The clearest measure depends on the decision context.
Expected counts
| Contact | No | Yes | Total |
|---|---|---|---|
| Cellular | 25,859.10 | 3,425.90 | 29,285 |
| Telephone | 2,566.04 | 339.96 | 2,906 |
| Unknown | 11,496.86 | 1,523.14 | 13,020 |
| Total | 39,922 | 5,289 | 45,211 |
Expected counts preserve the observed margins.
Homogeneity: compare category distributions
Question: Do account preferences have the same distribution across three regions?
Take a separate random sample of customers in each region and record Savings, Current, or Investment.
\[H_0:\text{The three regions have the same preference distribution.}\]
Use the same expected-count and chi-square formulas as an association test; here \(df=(3-1)(3-1)=4\).
Checking a continuous distribution
A chi-square goodness-of-fit test can compare binned numerical data with a proposed distribution.
| Step | Example: a normal model for settlement errors |
|---|---|
| Define bins | Cover the full range, including both tails |
| Find probabilities | \(p_i=F(b_i)-F(a_i)\) for each bin |
| Find expected counts | \(E_i=np_i\); keep expected counts adequate |
| Calculate | \(\chi^2=\sum(O_i-E_i)^2/E_i\) |
Adjust degrees of freedom for fitted parameters: \(df=k-1-m\).