Statistics for Analytics
Session 8: ANOVA & Regression

Today’s route
Explain variation with groups and fitted lines, then interpret an adjusted model.
Comparing Several Means
Why not many t-tests?
With \(k\) groups there are \(k(k-1)/2\) pairwise comparisons.
For 5 groups, that is 10 tests. At \(.05\) per test, the chance of at least one false positive can be much greater than 5%.
ANOVA starts with one global question.
The ANOVA hypotheses
\[H_0:\mu_1=\mu_2=\cdots=\mu_k\]
\[H_A:\text{not all population means are equal}\]
Rejecting \(H_0\) establishes that at least one mean differs. Follow-up comparisons identify which ones.
Real credit-limit groups
Question: Do mean credit limits differ across three recorded education groups?
| Education | \(n\) | Mean (NTD 000) | SD (NTD 000) |
|---|---|---|---|
| Graduate school | 10,585 | 212.96 | 135.47 |
| University | 14,030 | 147.06 | 120.67 |
| High school | 4,917 | 126.55 | 113.98 |
Grand mean across these 29,532 records: 167.27 thousand NTD.
Source: Yeh, UCI Default of Credit Card Clients. Records with “other/unknown” education codes are excluded from this three-group example.
Signal versus noise
\[F=\frac{\text{variation between group means}} {\text{variation within groups}}=\frac{MSG}{MSE}\]
Large \(F\) means group separation is large relative to background variation.
Partitioning variation
\[SST=SSG+SSE\]
| Source | Variation | Degrees of freedom |
|---|---|---|
| Groups, \(SSG\) | Between group means | \(k-1\) |
| Error, \(SSE\) | Within groups | \(N-k\) |
| Total, \(SST\) | Around the grand mean | \(N-1\) |
The degrees of freedom also partition: \((k-1)+(N-k)=N-1\).
ANOVA result
| Source | SS (thousand NTD)\(^2\) | df | MS | F |
|---|---|---|---|---|
| Groups | 35,975,139 | 2 | 17,987,570 | 1,148.68 |
| Error | 462,405,654 | 29,529 | 15,659 | |
| Total | 498,380,793 | 29,531 |
\(p<.001\), but effect size is more informative: \(\eta^2=.072\).
Finding: group membership accounts for about 7.2% of the observed variation in credit limits.
Conditions
Independent
Within and across groups
Normal
Residuals in each group
Equal spread
Similar group SDs
No extremes
Inspect plots
Check conditions visually
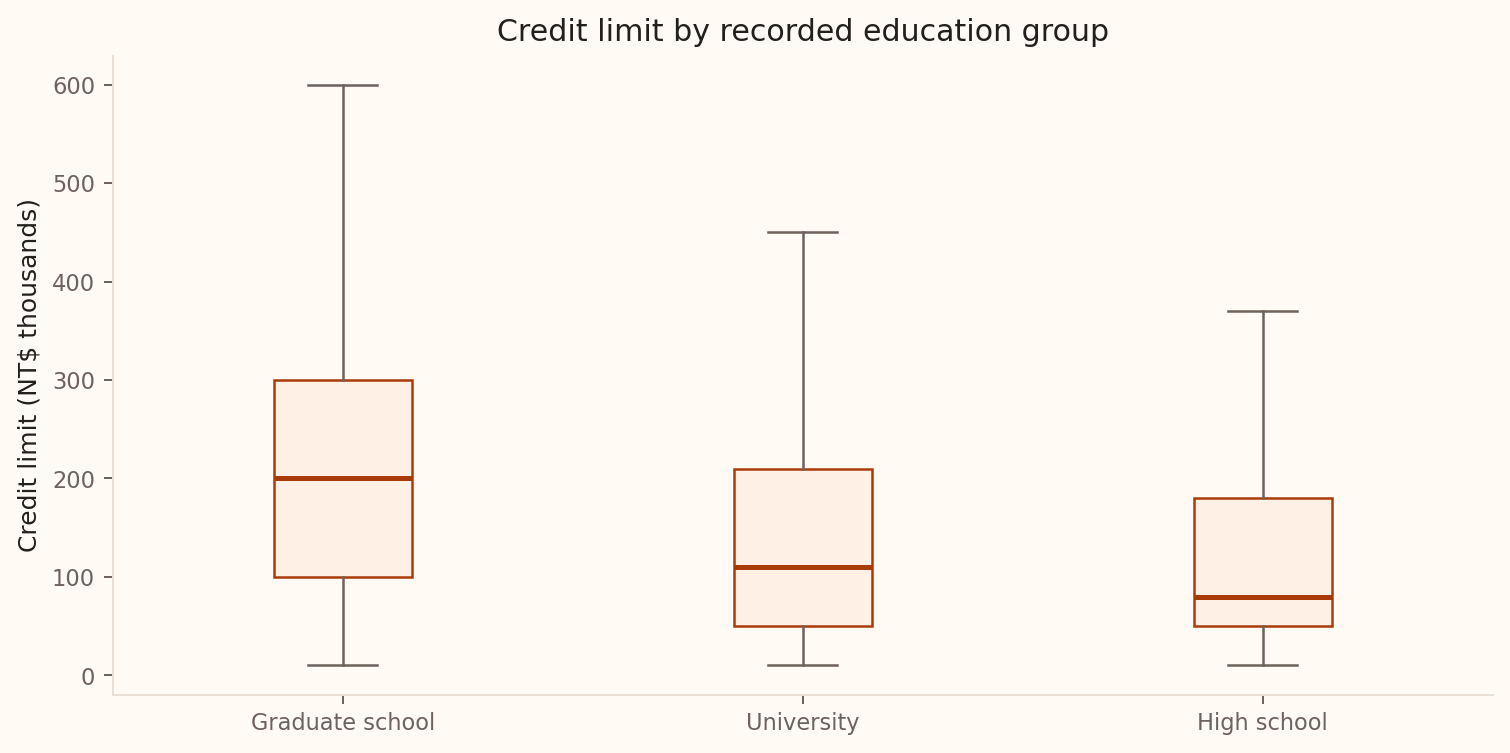
Large samples make the mean comparison stable, but Welch ANOVA or robust summaries may better address unequal spread and skew.
Source: UCI Default of Credit Card Clients. Outlier marks are hidden for legibility, not removed from analysis.
After a significant F-test
The global test does not identify differing pairs.
Use:
- prespecified contrasts;
- Tukey-adjusted pairwise comparisons;
- confidence intervals for group differences;
- an effect size such as \(\eta^2=SSG/SST\).
Complete the ANOVA reasoning
The education comparison gives \(F=1148.68\), \(p<.001\) and \(\eta^2=.072\).
- State what the global test establishes.
- Explain why a small p-value can coexist with 7.2% explained variation.
- Propose a follow-up comparison and one assumption to inspect.
Read the global ANOVA result
A three-group ANOVA gives p < .001. Under the model assumptions, which conclusion follows?
- All three pairwise differences are significant
- At least one population mean differs; further comparisons identify which
- Group membership causes the outcome
- The groups have equal variances
Correlation & Regression
Case: estimating a client’s bill
Question: How much can credit limit tell us about September bill amount?
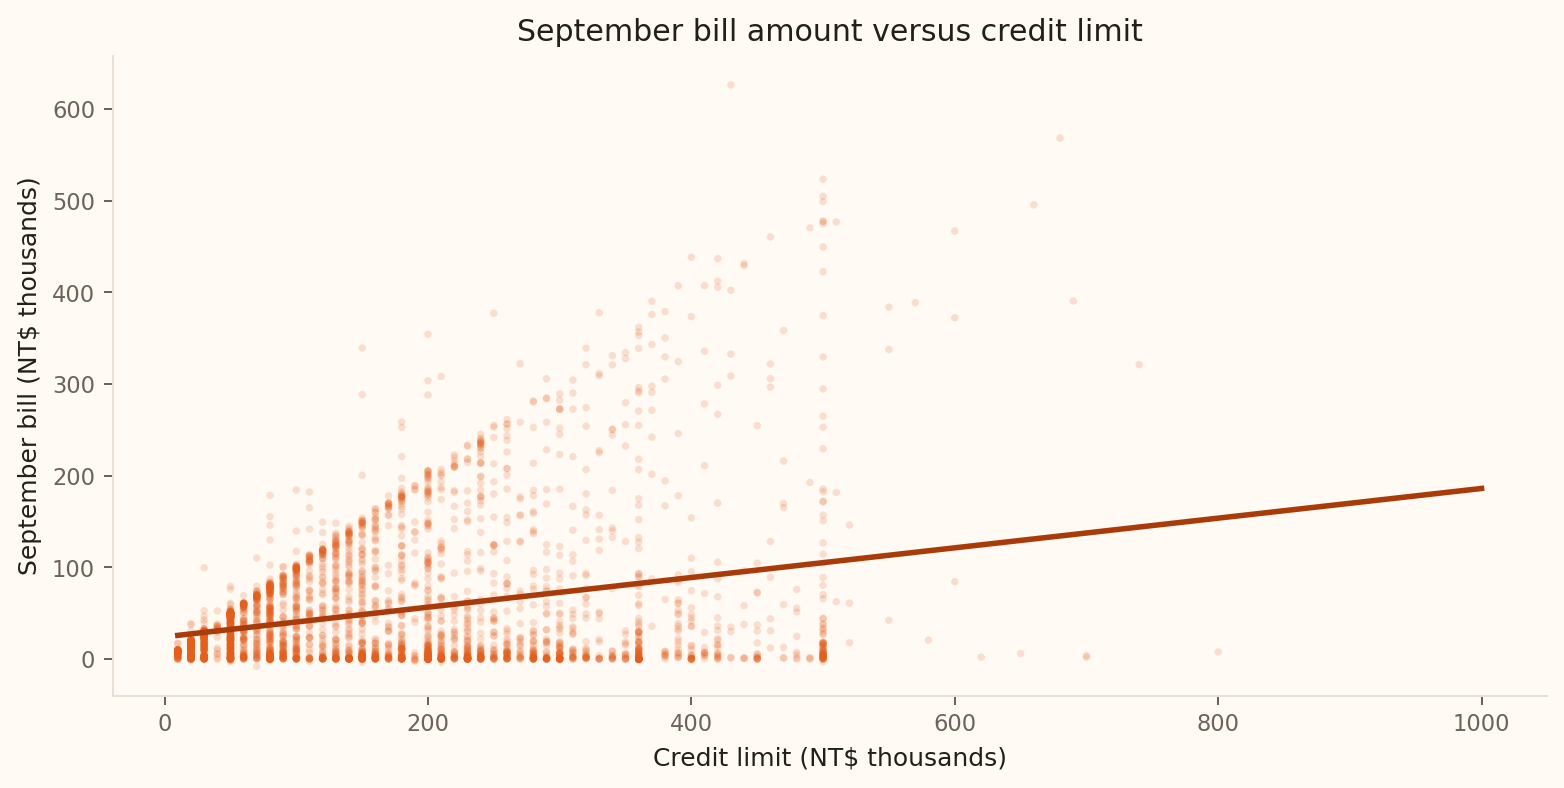
UCI Default of Credit Card Clients. Points: 3,500 sampled clients. Line: all 30,000 records. Amounts are in NT$ thousands.
Correlation
Pearson’s \(r\) summarises linear association between two numerical variables.
\[r=\frac{1}{n-1}\sum_{i=1}^n \left(\frac{x_i-\bar x}{s_x}\right) \left(\frac{y_i-\bar y}{s_y}\right)\]
\(-1\le r\le1\).
Always read direction, form, strength, and unusual observations from the scatterplot too.
What correlation captures
| \(r\) | Linear pattern |
|---|---|
| Near +1 | Strong positive |
| Near 0 | Weak or no linear pattern |
| Near −1 | Strong negative |
Correlation has no units. Shifting or rescaling by positive constants leaves it unchanged.
What does near-zero correlation mean?
For a set of loan records, Pearson’s correlation between risk score and loss is close to zero. What does this tell us about those records?
- There is no relationship of any kind.
- Changing the risk score cannot affect the loss.
- There is little linear association; a curved relationship may remain.
- The two variables are independent.
What correlation misses
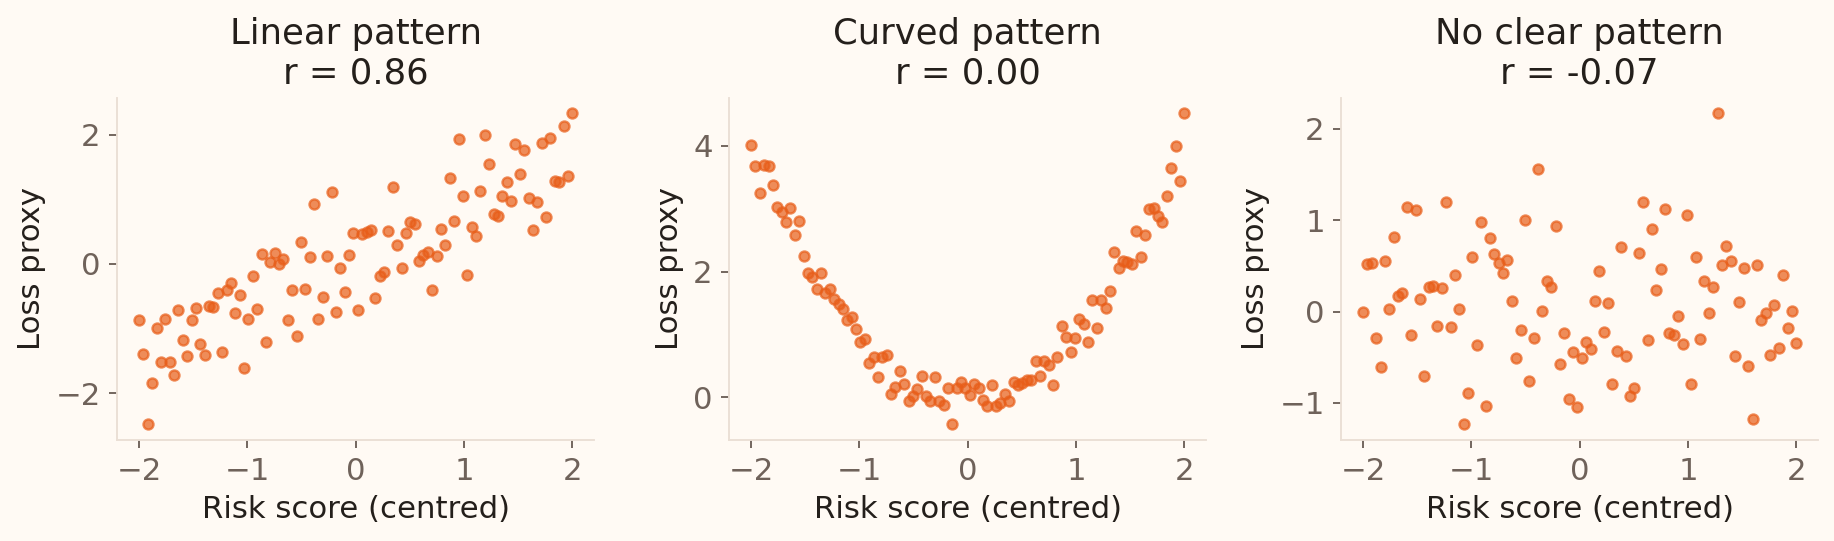
A correlation near zero can coexist with a strong curved relationship. Plots also reveal groups and influential observations.
Illustrative simulations generated in Python, seed 202602.
The population model
\[Y_i=\beta_0+\beta_1x_i+\varepsilon_i\]
| Term | Meaning |
|---|---|
| \(\beta_0\) | Mean response when \(x=0\) |
| \(\beta_1\) | Mean response change per unit of \(x\) |
| \(\varepsilon_i\) | Unexplained deviation |
Fitted line and residual
\[\hat y_i=b_0+b_1x_i\]
\[e_i=y_i-\hat y_i\]
Positive residual: the model underpredicts.
A fitted value lies on the line; a residual is the observation’s signed vertical distance from it.
Fit the line by least squares
Choose \(b_0,b_1\) to minimise
\[SSE=\sum_{i=1}^n(y_i-\hat y_i)^2=\sum e_i^2.\]
Squaring prevents cancellation and penalises large errors.
\[b_1=r\frac{s_y}{s_x},\qquad b_0=\bar y-b_1\bar x.\]
The fitted line passes through \((\bar x,\bar y)\), and the slope has units “response per predictor unit”.
Interpret in context
With bill amount measured in thousand NTD and credit limit in 10,000 NTD:
\[\widehat{\text{bill}}=24.09+1.620(\text{credit limit}).\]
Each additional 10,000 NTD of credit limit is associated with an estimated 1,620 NTD higher mean September bill.
This is an association across observed accounts, not a lending-policy effect.
Interpret the slope with units
Bill is measured in thousand NTD and credit limit in units of 10,000 NTD. The fitted slope is 1.620. What does it describe?
- An associated mean bill increase of 1,620 NTD per extra 10,000 NTD of credit limit
- A guaranteed 1,620 NTD increase for every client
- A causal increase of 16,200 NTD
- A 162% increase in default risk
Prediction & Inference
Keep the data range in view
Observed credit limits range from 10,000 to 1,000,000 NTD.
| Prediction point | Interpretation |
|---|---|
| Zero limit | The intercept is a fitted baseline outside the observed range |
| 200,000 NTD | Within the observed range |
| 2,000,000 NTD | Extrapolation; a new lending policy or customer group may behave differently |
Use the intercept to define the line; assess whether it has a meaningful practical interpretation.
Prediction
At \(x_0\):
\[\hat y_0=b_0+b_1x_0.\]
Mean-response interval
Uncertainty about \(E(Y\mid x_0)\)
Prediction interval
Uncertainty for one new \(Y\)
Prediction intervals are wider.
At a 200,000 NTD credit limit, the fitted mean bill is 56,491 NTD.
Decomposing variation
\[SST=SSR+SSE\]
| Quantity | Meaning |
|---|---|
| \(SST=\sum(y_i-\bar y)^2\) | Total variation |
| \(SSR=\sum(\hat y_i-\bar y)^2\) | Explained variation |
| \(SSE=\sum(y_i-\hat y_i)^2\) | Residual variation |
How much variation does the model explain?
\[R^2=\frac{SSR}{SST}=1-\frac{SSE}{SST}.\]
Here \(R^2=.0815\): credit limit explains 8.15% of observed September-bill variation in the fitted linear model.
For simple regression with an intercept, \(R^2=r^2\). Here \(r=.285\) indicates a positive, weak linear association.
LINE conditions
Linear
Mean pattern
Independent
Errors across units
Normal
Errors for exact inference
Equal variance
Across fitted values
Testing the slope
\[H_0:\beta_1=0 \qquad H_A:\beta_1\ne0\]
\[t=\frac{b_1}{SE(b_1)},\qquad df=n-2\]
This tests for a population linear association.
For the credit-limit slope:
\[t=51.58,\qquad df=29{,}998,\qquad p<.001.\]
Quantify the slope uncertainty
\[b_1\pm t^*_{n-2}SE(b_1).\]
| Quantity | NTD per extra 10,000 NTD of credit limit |
|---|---|
| Estimated slope | 1,620 |
| Conventional standard error | 31.4 |
| Model-based 95% interval | 1,558 to 1,681 |
Check the model conditions before relying on this interval.
Residuals versus fitted
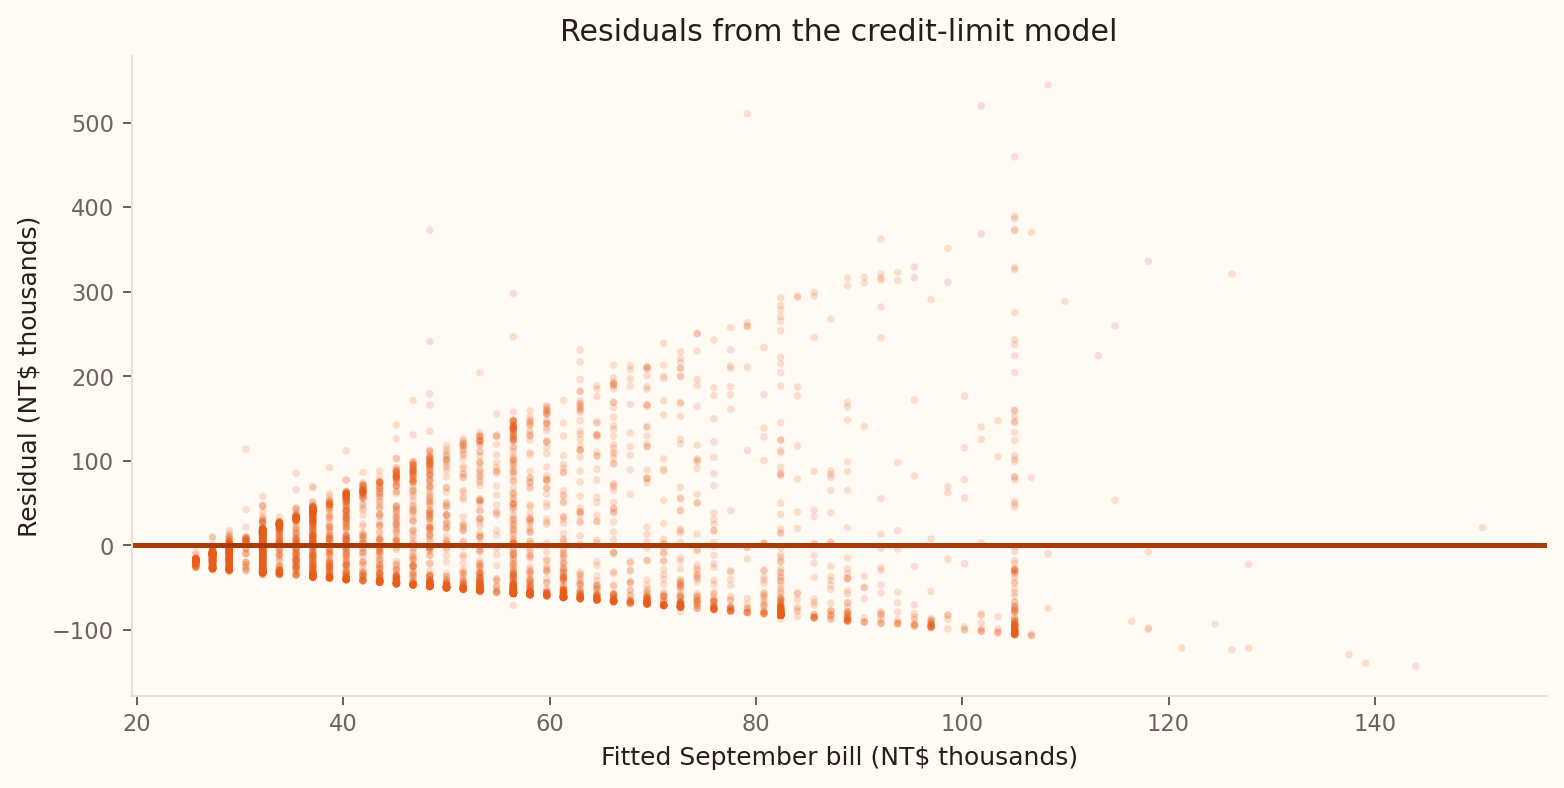
Address the changing residual spread before trusting model intervals.
Source: UCI Default of Credit Card Clients. Plot shows a reproducible 4,500-record sample of residuals from the all-record fit.
A First Multiple Model
Add predictors carefully
\[Y=\beta_0+\beta_1X_1+\cdots+\beta_pX_p+\varepsilon\]
Multiple regression describes conditional associations, holding included predictors fixed. Causal interpretation also needs an appropriate design.
Categorical predictors
Group September repayment status and choose no recorded delay as the reference:
| Status | One-month indicator | Two-or-more-months indicator |
|---|---|---|
| No recorded delay | 0 | 0 |
| One month late | 1 | 0 |
| Two or more months late | 0 | 1 |
Each indicator coefficient compares that group with the reference, holding other predictors fixed.
Multiple-regression output
| Predictor | Estimate | SE | p-value |
|---|---|---|---|
| Intercept | 19.888 | 1.654 | <.001 |
| Limit (per 10,000 NTD) | 1.659 | 0.032 | <.001 |
| Age (years) | 0.111 | 0.044 | .012 |
| One month late | −21.368 | 1.242 | <.001 |
| Two or more months late | 21.315 | 1.349 | <.001 |
Adjusted \(R^2=.101\). An extra 10,000 NTD of limit is associated with 1,659 NTD higher mean bill, holding age and status group fixed.
UCI credit data, all 30,000 records. Bill and coefficients are in thousand NTD; conventional OLS standard errors.
Session 8 takeaway
- ANOVA tests a global difference; adjusted comparisons locate it.
- Least squares fits a line by minimising squared residuals.
- Interpret slopes with units and check the conditions for inference.
- Multiple-regression coefficients hold included predictors fixed.
Next: examine model behaviour, compare alternatives and complete a banking analysis.
Reference
Slope uncertainty and interpretation
\[SE(b_1)=\frac{s_e} {\sqrt{\sum(x_i-\bar x)^2}},\]
where
\[s_e=\sqrt{\frac{SSE}{n-2}}.\]
The interval is \(b_1\pm t^*_{n-2}SE(b_1)\).
Here \(SE(b_1)=31.4\) NTD per 10,000 NTD of limit; the model-based 95% interval is 1,558 to 1,681 NTD higher mean bill.
Write the regression finding
For credit limit and September bill amount:
- Estimated bill increase per extra 10,000 NTD of limit: 1,620 NTD.
- Model-based 95% interval: 1,558 to 1,681 NTD; \(p<.001\).
- \(R^2=.0815\); residual spread changes with fitted bill amount.
Write three sentences covering association, usefulness for prediction, and the next analytical check.
Inference for one variance
For normal data,
\[\frac{(n-1)s^2}{\sigma_0^2}\sim\chi^2_{n-1}.\]
This gives tests and confidence intervals for a population variance. The method is sensitive to non-normality.
A 95% interval is \([(n-1)s^2/q_{.975},\ (n-1)s^2/q_{.025}]\), where \(q_u\) is the \(u\) quantile of \(\chi^2_{n-1}\).
Comparing two variances
For independent normal samples under \(H_0:\sigma_1^2=\sigma_2^2\),
\[F=\frac{s_1^2}{s_2^2}\sim F_{n_1-1,n_2-1}.\]
In routine mean comparisons, Welch’s method is usually preferable to testing variances first.