Statistics for Analytics
Session 9: Model Checking & a Complete Analysis

Today’s route
Interpret an adjusted model, check its behaviour and communicate a defensible analytical decision.
Reading & Comparing Models
What the first model leaves to explain
The simple model from Session 8 estimates September bill using credit limit:
\[\widehat{\text{bill}}=24.09+1.620(\text{limit}),\qquad R^2=.0815.\]
Bill is in thousand NTD; limit is in units of 10,000 NTD.
Today’s question: can extra predictors improve the explanation, and what evidence would justify using the model for prediction?
Credit-data example
| Variable | Role | Unit |
|---|---|---|
| September bill | Response | Thousand NTD |
| Credit limit | Predictor | 10,000 NTD |
| Age | Predictor | Years |
| Repayment-status group | Predictor | Two indicators; no recorded delay is the reference |
The fitted sample contains all 30,000 published records.
Source: Yeh, UCI Default of Credit Card Clients. This model describes recorded September bills.
ANOVA and regression
ANOVA is a linear model with categorical predictors.
\[Y_i=\beta_0+\beta_1I(\text{University})+ \beta_2I(\text{High school})+\varepsilon_i\]
The coefficients compare each group with Graduate school, the reference category.
Interpret an adjusted comparison
The coefficient for two or more months late is +21.315, with bill in thousand NTD. What does it describe?
- A 21.315% increase in default risk
- An estimated 21,315 NTD higher mean bill than the reference group, holding limit and age fixed
- A guaranteed 21,315 NTD increase for each client
- The causal effect of delaying repayment
Overall F-test
\[H_0:\beta_1=\cdots=\beta_p=0\]
\[F=\frac{SSR/p}{SSE/(n-p-1)}.\]
The test asks whether the predictors collectively improve on an intercept-only model.
Adjusted \(R^2\)
\[R^2_{adj}=1-(1-R^2)\frac{n-1}{n-p-1}.\]
Unlike \(R^2\), adjusted \(R^2\) penalises adding predictors that contribute little.
It is not a substitute for out-of-sample validation.
Model Diagnostics
Diagnose residual patterns
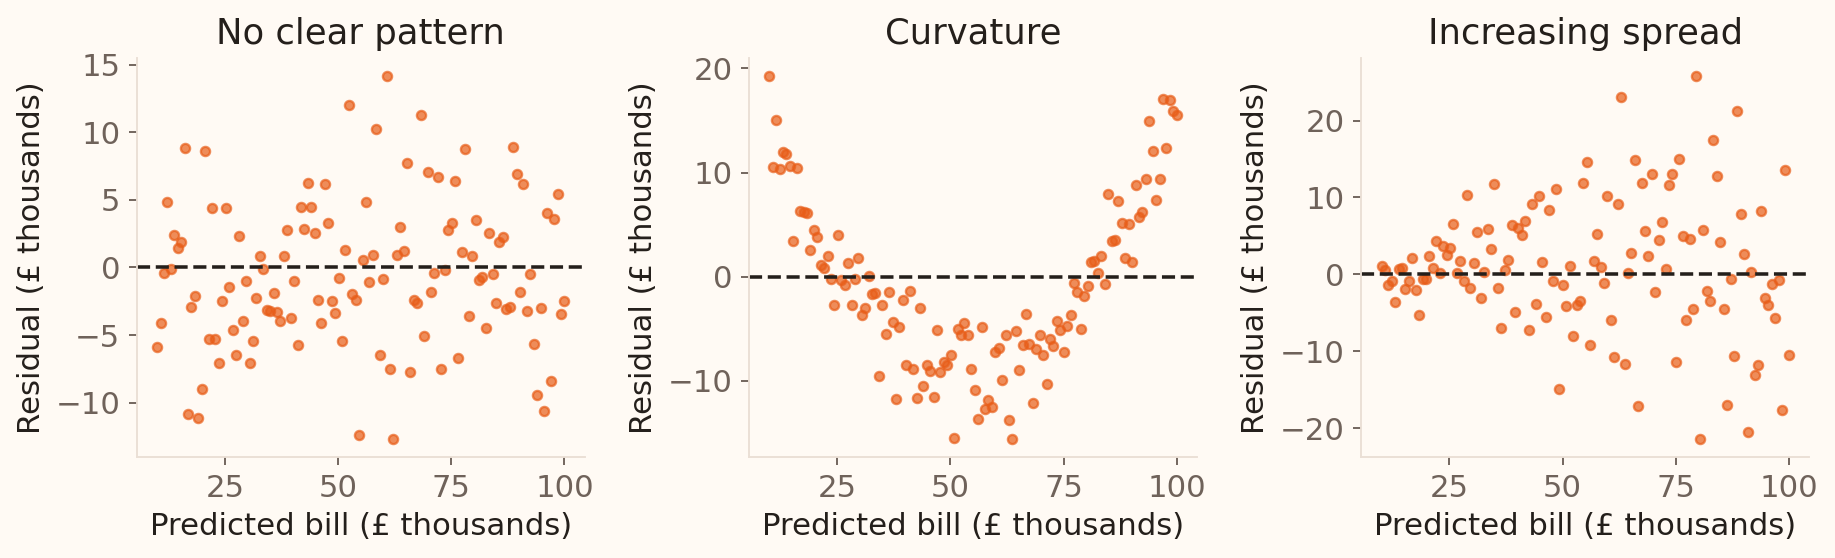
| Pattern | What to investigate |
|---|---|
| Curve | Mean relationship, transformation, or missing terms |
| Funnel | Changing variance and the standard-error method |
Illustrative bill-model simulations, seed 202609.
Normal residuals
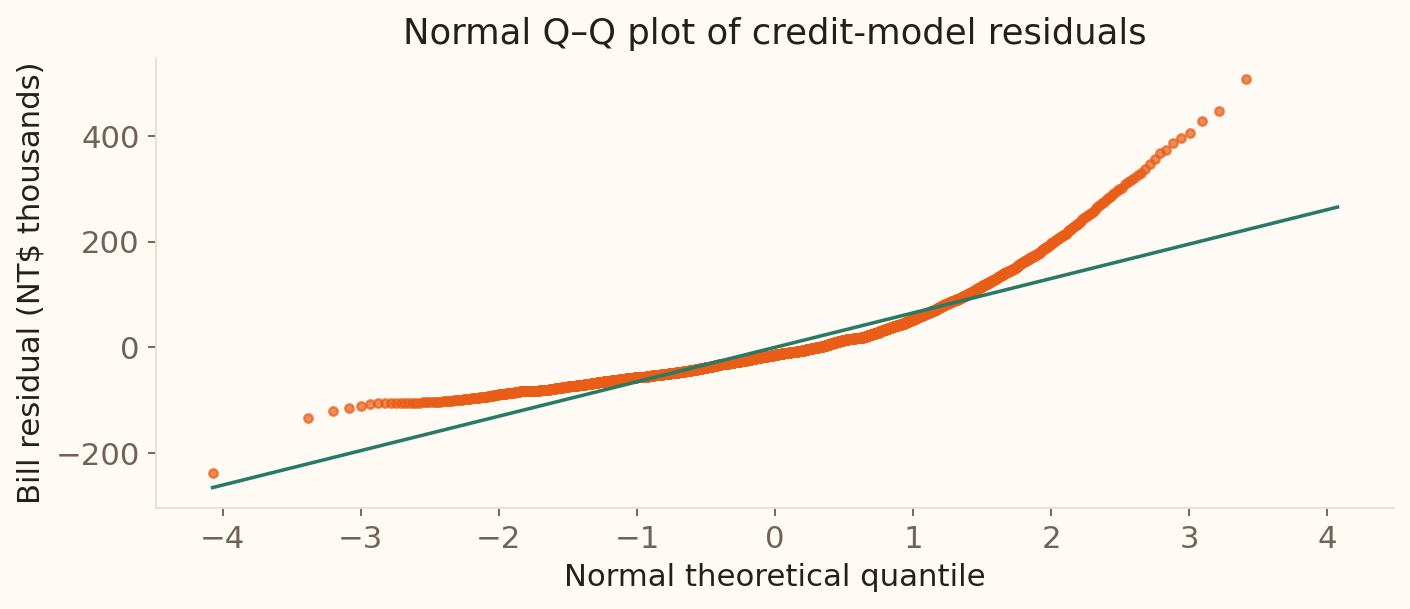
The heavy tails deserve investigation. Normality matters most for exact small-sample inference.
UCI Default of Credit Card Clients. Residuals from the model fitted to all 30,000 records; plotted quantiles are thinned for legibility.
Independence
Plot residuals in time or collection order.
Patterns may indicate:
- seasonality;
- serial correlation;
- repeated observations;
- omitted process changes.
Dependence requires a model that reflects the data structure.
Outlier, leverage, influence
| Concept | Unusual in… | Main concern |
|---|---|---|
| Outlier | Response direction | Large residual |
| High leverage | Predictor space | Can pull the line |
| Influential point | Fitted result | Changes estimates materially |
Influence combines position and residual size.
Which point changes the fitted line?
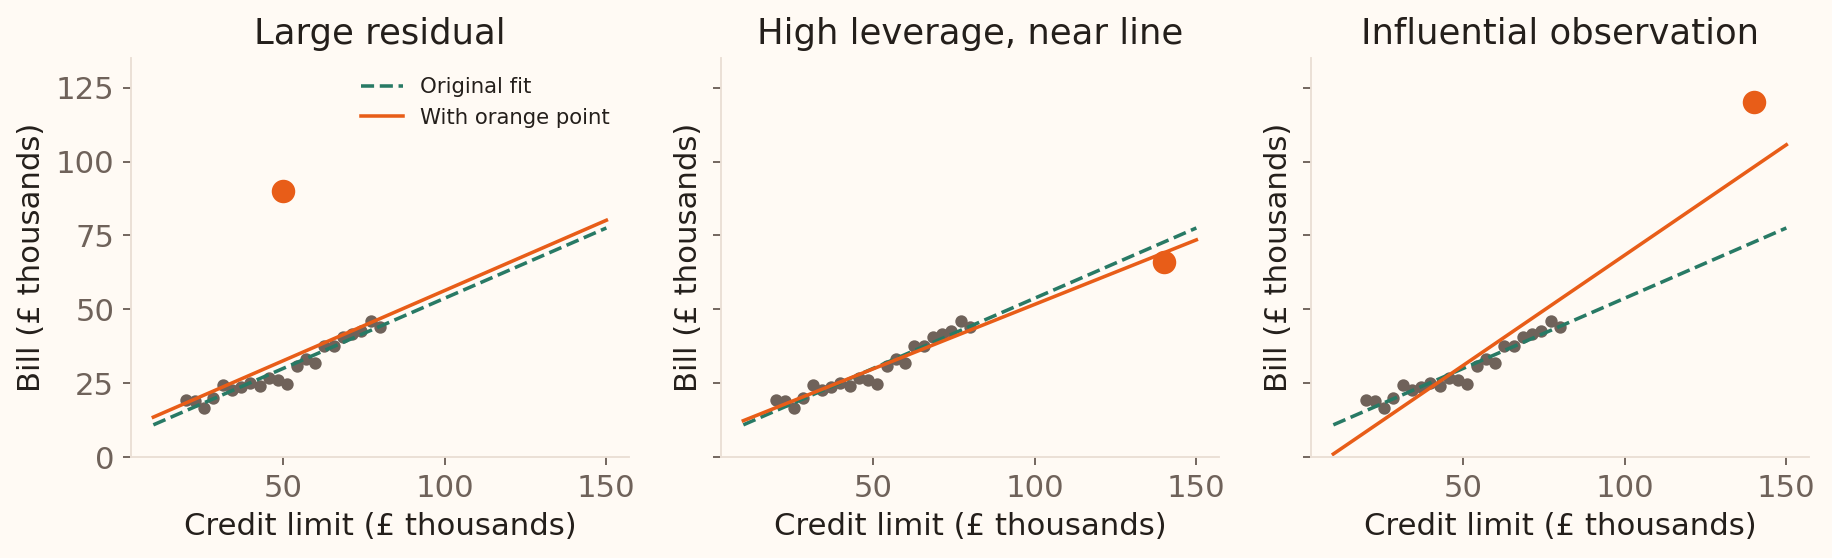
Verify the record, understand its context, compare fits with and without it, and report sensitivity.
Illustrative data, seed 202609. Green dashed line: original fit. Orange line: fit including the highlighted point.
Collinearity
Highly related predictors make individual coefficients unstable.
Signs include:
- large standard errors;
- coefficients changing with small model changes;
- high variance inflation factors;
- strong predictor correlations.
Prediction may remain adequate even when interpretation is unstable.
Building & Validating
Selecting predictors
| Strategy | Start | Next step |
|---|---|---|
| Forward selection | A baseline model | Add a justified predictor and reassess |
| Backward elimination | A candidate full model | Remove a predictor and reassess |
Compare adjusted \(R^2\), validation error, and interpretability. Preserve variables required by the scientific question.
Prediction needs validation
Train
Estimate model
Validate
Tune choices
Test
Final performance
Monitor
Drift after launch
Never evaluate predictive performance only on the fitting data.
Choose metrics for the decision
| Goal | Possible metric |
|---|---|
| Penalise large errors | RMSE |
| Robust typical error | MAE |
| Explain in-sample variation | \(R^2\) |
| Compare likelihood models | AIC/BIC |
No single metric answers every modelling question.
Transformations
Transform when theory and diagnostics support it.
| Pattern | Possible response |
|---|---|
| Strictly positive, right-skewed outcome | \(\log Y\) |
| Multiplicative effect | \(\log Y\) or \(\log X\) |
| Curvature | Polynomial, spline, transform |
| Changing variance | Transform or robust SE |
Interpret transformed coefficients on the transformed scale.
Some recorded bills are zero or negative, so a direct log transformation is undefined for them.
A Complete Analysis
Analysis workshop: define the decision
A bank team wants to understand September bills and assess whether the analysis could support later predictions.
| Available evidence | Scope |
|---|---|
| 30,000 credit-card records | One published historical dataset |
| Limit, age and September repayment status | Candidate predictors |
| September bill | Numerical outcome |
Define the observational unit, response and units. Which predictors would be available at the intended prediction time?
Analysis workshop: compare the evidence
| Result | Credit limit alone | Limit, age and status group |
|---|---|---|
| Limit slope (NTD per 10,000 NTD) | 1,620 | 1,659 |
| \(R^2\) | .0815 | .1007 |
| Adjusted \(R^2\) | .0814 | .1006 |
- Interpret the adjusted limit slope.
- Describe how much the observed fit improves.
- Identify what these results leave unanswered about prediction.
Analysis workshop: choose the next checks
The simple model has changing residual spread and heavy tails. Some recorded bills are zero or negative.
Propose a short analysis plan covering:
- Diagnostics for the expanded model and treatment of unusual records.
- A justified transformation or uncertainty method.
- Validation data, an error metric and one limit on the claim.
Is this model ready for prediction?
Submit a three-sentence recommendation: what the banking models show, which checks or validation are needed, and what decision the evidence currently supports.
Session 9 takeaway
- Interpret coefficients conditional on the included predictors.
- Use residuals, data context and sensitivity checks to diagnose a model.
- Keep model selection separate from final performance evaluation.
- Communicate the question, evidence, uncertainty and next action.
Bring unresolved method and reporting questions to the course Q&A.
Reference
Models are useful simplifications
Judge a model by its purpose, assumptions, validation, interpretability, and consequences.